A Better Style Score Does Not Mean a Better Text
If you score text readability automatically, this post hands you one way that scoring quietly lies. Our style metric improved on all five axes at the exact moment 90% of the source text had vanished.
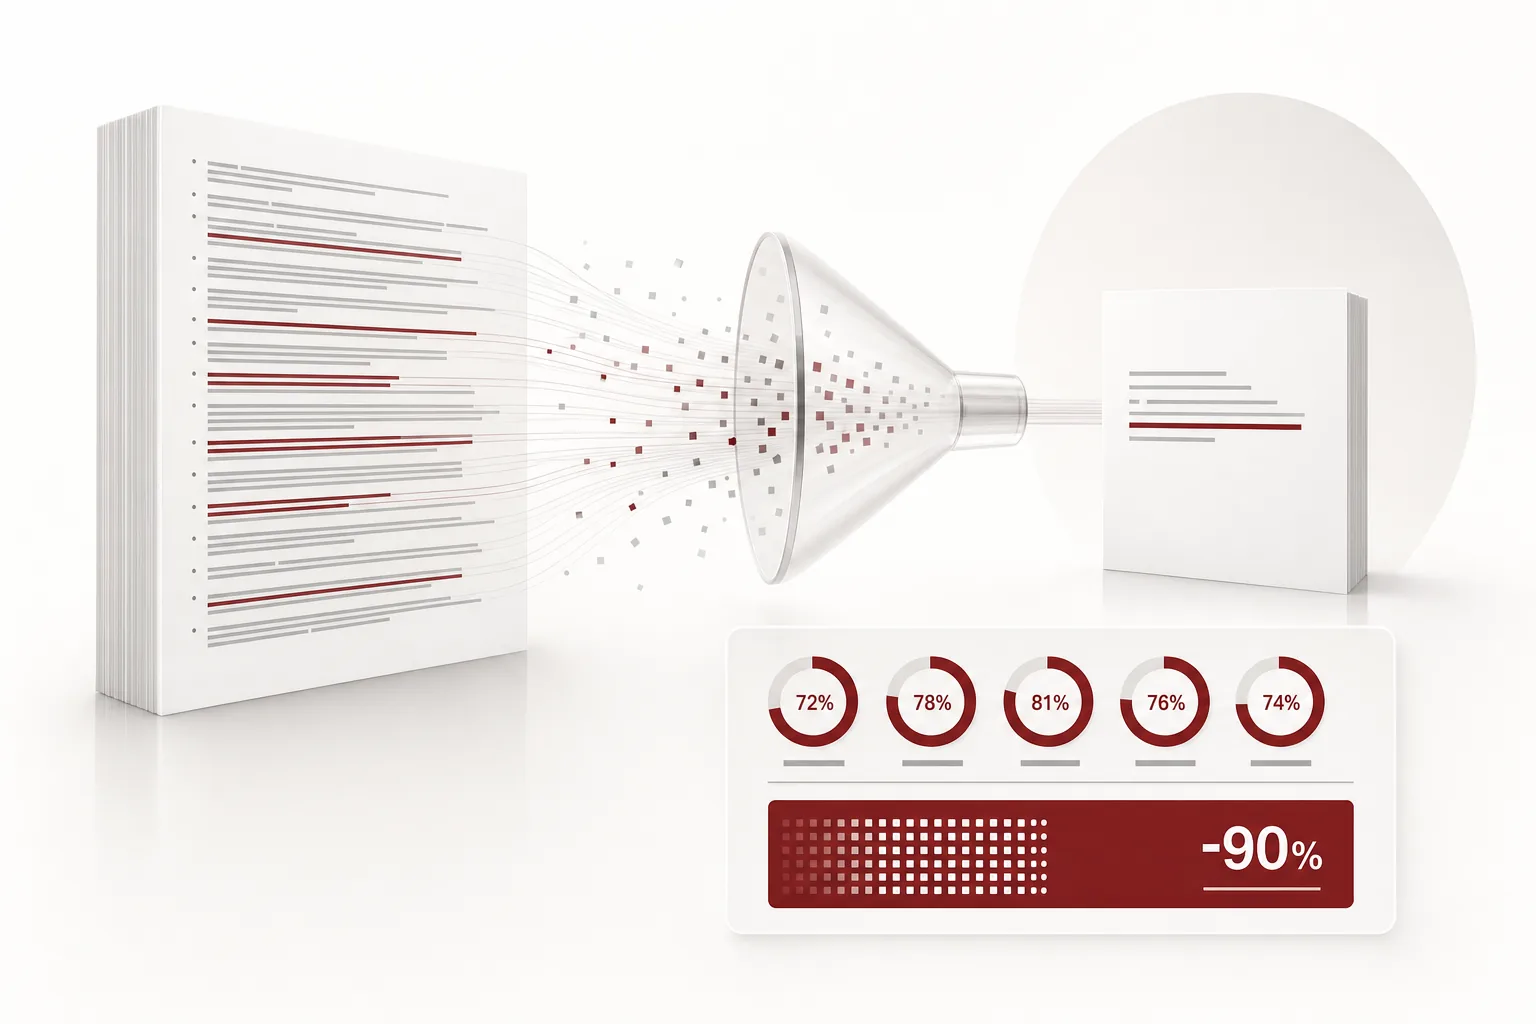 A visual metaphor for the article’s key idea.
Plain terms
A room where you tidied your things and a room where you threw them out look identical in a photo. A style metric is that photo. It measures whether the room is clean. It does not measure whether your things are still there. This post argues for putting an inventory list next to the photo.
 Infographic generated by NotebookLM from the sources.
What we did
Replies that public agencies send to citizens are usually hard to read. We used published legal interpretation replies from the Korea Ministry of Government Legislation. They carry an open government license that permits commercial use, and each record pairs a question with an answer.
We asked a model to rewrite those answers in plain Korean, and built a separate metric to measure how much easier they became. It counts long sentences, bureaucratic stock phrases, passive constructions, nominalizations, and the density of statute citations.
Before using the metric we checked that it can separate anything at all. We fed it bureaucratic originals and plain writing, and discarded every axis that failed to tell them apart. The Chinese-character density axis died there: the ministry writes in pure Hangul, so both sides scored zero. Bureaucratic Korean is a vocabulary and sentence-structure problem, not a script one.
What came out
The first result looked perfect. All five axes improved sharply. But a 2,532-character original had become 242 characters. The model had not simplified the text. It had summarized it.
In plain terms: the model kept the conclusion and dropped the reasoning, and the style score went up because the sentences it dropped were the hard ones.
The cause was our instruction, not the model. We had written “remove statute citations from the body.” You cannot tell a model to discard information and then blame it for discarding.
The fix was not lowering the threshold. Given a whole document at once, the model summarizes. So we split the source into paragraphs and had each one rewritten on its own. That leaves no room to drop anything. The pass rate went from one in ten to nine in ten.
Final numbers: sentences over 110 characters fell from half to zero, and stock phrases, passives and nominalizations all dropped below a tenth of their original rate. Length stayed at 98% of the original, and 370 of 378 statute names survived.
| Measure | Original | Rewritten |
|---|---|---|
| Sentences over 110 characters | 50.0% | 0.0% |
| Stock phrases per sentence | 0.76 | 0.03 |
| Passives per sentence | 0.32 | 0.03 |
| Nominalizations per sentence | 0.27 | 0.03 |
| Length vs original | 1.00 | 0.98 |
Based on 101 records. Full figures and effect sizes live in the ledger cited below.
What to change
Keep the style metric and the preservation metric separate. Do not merge them into one score. Style improves as content is discarded, so a merged score lets each one hide the other.
flowchart TB
    SRC["Bureaucratic original<br/>101 legal interpretation replies"] --> RW["Plain-language rewrite"]
    RW --> S["Style metric, five axes<br/>long sentences · stock phrases · passives · nominalizations · citation density"]
    RW --> P["Preservation gate, three checks<br/>length at least 60% of the original<br/>statute names survive<br/>numbers survive"]
    S --> Q1["Easier?"]
    P --> Q2["Still there?"]
    Q1 --> G["Both must pass to keep"]
    Q2 --> G
Two measurements that split from the same rewrite. The style metric checks whether the room is clean; the preservation gate checks whether the things are still in it.
We measured preservation three ways: whether the rewrite fell below 60% of the original length, whether statute names survived, and whether numbers survived. Failing any one drops the record. Code decides this, not a human reading samples.
And when a gate rejects a lot, resist lowering the threshold first. When our pass rate fell to one in ten, lowering it would have sent summaries straight into the training set. The problem was not the threshold. It was how we fed the input.
 Infographic generated by NotebookLM from the sources.
What we cannot claim
Our own checkers were wrong four times getting here. One compared effect sizes without checking direction, and passed axes that moved the wrong way. One compared statute names by exact string and counted reformatted citations as lost. One counted case-file numbers as substantive content and discarded a healthy 15%. One searched a single storage prefix and reported a checkpoint missing that was in fact there. Every time, the thing measuring was wrong, not the thing measured. When a gate behaves strangely, suspect the gate before the subject.
What this post does not claim: we have not trained a model yet. This is a data and metric result, not a model result. Our plain-language control set was our own engineering blog, which is a different genre from citizen replies. So we can say the metric separates bureaucratic writing from plain prose, but not that it separates good citizen replies from bad ones. The sample is 101 records, and we did not read every rewrite.
Source: measurement ledger whitepapers/data/ledger/2026-09-02-hkp-govspeak-plain-rewrite.json;
source material from the Korea Ministry of Government Legislation open API
under an open government license (dataset page).