Raise the Model, or Thicken the Harness: The Cost-Quality Break-Even of Autonomous Agents
Cloud and AI engineers who run autonomous agents in production have probably faced the same question at every budget meeting. When a job keeps failing, do you thicken the harness around the model (verification gates, standing rules, hot memory, retry structure, routing, runbook), or do you move the model itself up one tier? A year of measurements has shown that the harness is no longer a fixed decoration. This post introduces the analysis paper recently published by ThakiCloud AI Research, “Harness Scaling Laws: The Cost-Quality Break-Even Between Richer Harnesses and Stronger Models.” The paper formalizes a cost-quality frontier on the two axes of model tier and harness richness, and derives an equipmarginal (equal-marginal) break-even rule that decides, in dollars, how far harness investment pays and when to switch to a model upgrade.
Why the Harness Became the Second Scaling Axis
In much of the scaling literature, deploying autonomous agents in production has been a matter of choosing a single model tier. The harness was treated as a fixed constant, and its price was never accounted for. A year of measurements has made it impossible to keep that convention.
The clearest case is the StateM runtime result on Terminal-Bench 2.1. Attaching a fixed StateM profile moves GPT-5.6 Luna from 76.7% to 85.4%, a number above the bare-harness baseline of 84.9% for the stronger tier GPT-5.6 Sol xhigh on the same bench. Under the same harness, Sol xhigh recorded 95.3% raw accuracy across 445 trials and succeeded at least once on all 89 tasks. The cost gap is far larger than the quality gap. A harness-equipped DeepSeek-V4 Flash setup ran at 88.1% accuracy for roughly $15 of API usage on a final-score basis, while the GPT baseline in the same quality band spent $574.68. As a run-cost ratio that is 38.3x, and the paper is explicit that this ratio is an example computed from cited numbers, not a parameter estimate.
These numbers show the harness is a second scaling axis. They do not say where the axis bends. StateM measured how far a fixed harness carries one benchmark. This paper asks, for each workload class, where the marginal dollar of harness stops beating the marginal tier of model.
Compensator-Decay Quality Model
The paper formalizes the interaction of the two axes as a single quality model. Let the model capability be M and the total harness leverage in workload class w be L(w; h). The harness consists of K components, gate depth, number of rules, memory depth, retry cap, skeptic count, runbook freshness, and each component i sits at level h_i and carries leverage L_i(w; h_i) for how much of class w’s failures it removes. Quality is defined as follows.
$Q(w; t, h) = 1 - \exp(-\Phi(w; t, h))$, $\Phi(w; t, h) = \kappa_M M(t) + \kappa_L(w)\, s(M(t))\, L(w; h)$
The key term here is $s(M) = (M_{max} / M)^{\gamma}$ ($\gamma > 0$). The harness is a device that repairs exactly the failure patterns that surface more when the model is weak. s(M) amplifies leverage as capability drops, and equals exactly 1 at the frontier tier, where the marginal gain of harness naturally disappears. Models with large capability leave behind few failures of the kind the harness can fix. Both axes saturate. Capability has an exp-shaped ceiling, and each harness component’s leverage rises to an internal optimum and then flattens or declines.
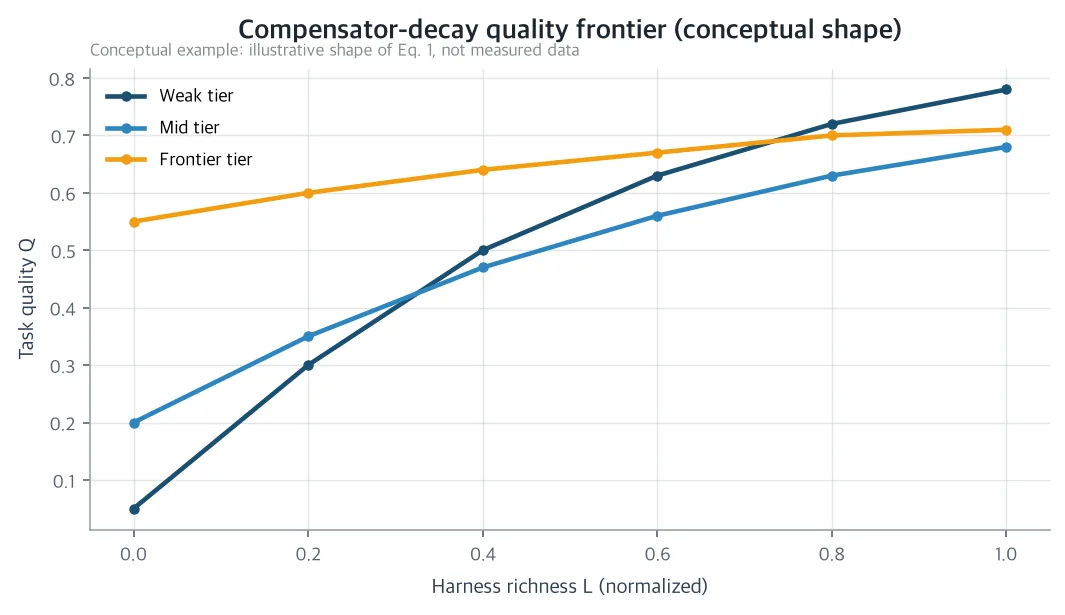 An illustrative conceptual drawing of the form of equation (1): harness leverage is steepest on the weak-model side, flattens toward the frontier, and at the point where the harness is rich enough, a weak model plus harness setup overtakes the strong model plus bare harness baseline. Not measured data.
The internal peak is an assumption backed by measurements, not a guess. Keep adding skeptics to verification, and the moment per-skeptic detection recall drops below 50%, vote dilution makes hard items less safe. The skill-loading experiment showed that harness components can have negative marginal effects, and runbook staleness is evidence in the same direction. Harness richness is not unconditionally good: each component has a point beyond which it hurts.
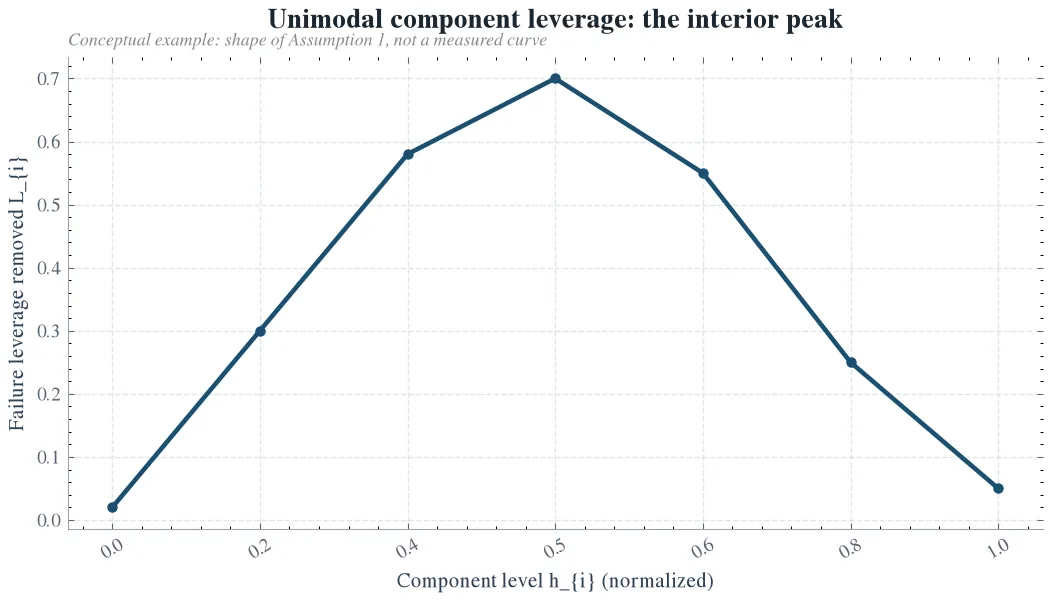 An illustrative conceptual drawing of premise 1: a single harness component removes failures up to an internal optimum and then loses leverage. The descending region is backed by measurements for vote dilution below 50% per-skeptic detection recall and for skill-induced regressions, but the curve itself is not measured.
The cost side is written with the same specificity. The expected cost of one attempt in class w, tier t, harness h is $C(w; t, h) = p(t)\, n(w)\, o(h) + g(h)$. The token multiplier o(h) accounts for the token consumption produced by retries, skeptics, and memory, and g(h) amortizes the writing, maintenance, and audit cost of the activated components. Divide each component’s marginal quality by its marginal cost to get the marginal quality per dollar m_i, and the workload’s token volume n(w) cancels out of numerator and denominator. The break-even becomes a scale-free comparison independent of task size.
The Equipmarginal Break-Even Rule
The paper’s core result, the equipmarginal optimality theorem, reads like this: among the setups that achieve a target quality Q*, the lowest-cost interior solution is one where the marginal quality per dollar of every active lever converges to the same value lambda, and inactive levers are at or below it. This directly ports the structure in which the original scaling law derived the optimal allocation under a fixed compute budget via KKT conditions, into a price comparison on the harness axis.
The form this theorem takes in real decisions is a single break-even inequality. Moving up to the next model tier is cost-optimal if and only if no remaining harness lever has marginal quality per dollar higher than that tier upgrade.
$\kappa_L(w)\, s(M)\, \max_i \frac{L_i’(h_i)}{\rho_i} \cdot \frac{1}{p(t)} \;<\; \frac{1 - e^{-\Delta\Phi}}{\Delta p\, o(h)}$
In words: keep investing in the harness as long as the lever that buys the most quality per dollar at the current tier is more efficient than the price step (delta-p), and only justify a model upgrade when the inequality flips. The interaction, that a weak model gets more quality from one harness dollar, also comes out as a corollary with an exact boundary. In the region where the lever is on the rising side and M exceeds the threshold M(w, L), the marginal quality per dollar m_i is monotonically decreasing in M. M is where the capability term kappa-M times M begins to dominate the compensator-decay term, and it is one of the objects the calibration procedure must actually estimate.
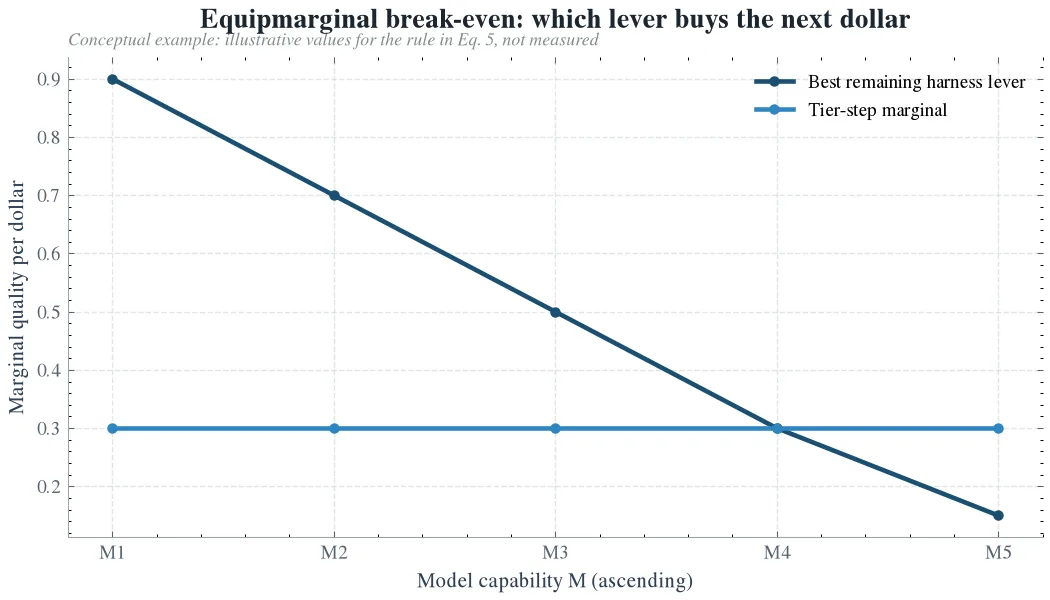 An illustrative conceptual drawing of the decision structure of equation (5) with example numbers: as model capability rises, the marginal quality per dollar of the remaining harness levers falls, while the marginal quality per dollar of a tier upgrade stays nearly flat, so below the crossing the harness levers pay and above it the upgrade pays. Not measured values.
Four Measured Instance Sets: Consistency Check, Not Estimation
The paper states its own position honestly. Because it is an analysis paper, the four measured instance sets below are not estimates of the model parameters (gamma or the kappa ratio), but consistency checks of three properties of the rule.
StateM gives two things cleanly. The order reversal under a fixed harness (Luna plus harness at 85.4% above the bare Sol xhigh baseline of 84.9%), and the run-cost ratio within the same quality band (roughly $15 against $574.68, 38.3x). But the absolute per-tier gain is not one-sidedly in favor of the weakest tier: GPT-5.5 xhigh plus 9.0, Luna plus 8.7, DeepSeek plus 5.4, so the marginal slope itself is not established by StateM alone. The verification fan-out measurement shows the internal optimum directly. A Haiku verifier with one skeptic ($3.46) is the unique Pareto-optimal setup, dominating the 3.3x and 5.5x more expensive Sonnet and Opus verification stages, and the most expensive tier is never optimal. The router and memory stack show that the cheap end of the harness curve can be bought by component compression. Even in a production router with more than 1,600 skills, the ideal decomposition (ORACLE) reached only 63.6% step coverage, and the cross-lingual bridge for mixed Korean-English queries is a constraint that a stronger model alone does not remove. The rule-gated analytics research is the cleanest instance of property (i). A 7B agent with a deterministic rule layer beat the directly prompted 32B baseline on business truthfulness.
What the four instance sets and the skill negative control show is “the mixed shape of the rule’s properties.” The marginal advantage of the weak tier is one clean instance, the per-component internal optimum is directly measured, and workload-class dependence is backed by the price of transfer experiments (general transfer 0.55 macro against mechanism-matched plus 10.04). In the paper’s phrasing, the strongest evidence an analysis paper can carry is exactly this mixed shape.
Extending the quality target to pass-at-k opens one more channel that the average quality model does not see. A model that loses state tracking fails the same way on every retry. Components that reduce the correlation between failures (checked transitions, recoverable runbook, durable state) raise pass-at-k even when average Q stays put. This channel pushes the break-even further toward the harness side.
What Changes When This Is Built Into the Platform
From ThakiCloud’s vantage point, the primary consumer of this rule is Paxis. A routing policy emerges that prices, per workload class, the cheapest “model plus harness” combination that holds quality, with the price parameters. Verification gates, hot memory, rule count, and retry loops stop being taste-based configuration items and become priced knobs, and the model tier becomes the second dial.
The policy’s behavior is concrete. Start at the cheapest tier with a bare harness, and repeat the greedy step of buying the lever with the highest marginal quality per dollar while quality is below target. Before moving to the model tier, exhaust the cheap end of the harness, meaning moves that buy expensive components by compression. When all active levers fall below the dead band, reject the workload or escalate it. For pass-at-k targets, tilt toward the components that reduce correlation (variance) on ties.
On the Metis side, the token-economics calculation changes. When a harness is attached, the token multiplier o(h) rises, but in exchange the model price p(t) that holds the same quality can drop by factors of several to several tens. $15 and $574.68 show one end of that, and the criterion that decides when and which lever to buy in between is the break-even inequality.
The social contribution is lowering the cost floor of reliable agent automation. The premise that enterprise workflow automation requires frontier compute is relaxed by making cheap models reliable through harness engineering. The scientific contribution is setting, for the first time, a factorial cost-quality frontier on the two axes of model tier times harness richness. It extends StateM’s single-benchmark harness scaling into a general break-even rule that says from when a model upgrade starts not paying for itself, and places the power-law discipline of the original scaling law on the harness axis.
Limits: Where This Rule Can Be Wrong
The limits are written concretely. First, domain concentration. The evidence is concentrated in terminal and agent execution, and in ThakiCloud’s own skill-routing harness; transfer to other classes is a structural expectation, not a verified fact. Second, price snapshots. Tier prices are at a point in time, and in a market where frontier prices fall repeatedly, the break-even depends on price drift by construction. That is why quarterly re-solving of price drift is part of the rule, not an appendix. Third, functional form. The quality model Q = 1 - exp(.) is a working hypothesis, not a theorem; skill-induced failures with negative marginal effects enter currently only through unimodality, and the descending side is not yet priced into the cost model. Fourth, quality proxies and platform concentration. Three of the four instance sets come from one platform family, and independent replication across vendors and runtimes is an open requirement. Fifth, the best-shot versus per-trial gap. Reading the 445 trials over 89 tasks as reliability inflates the harness’s apparent gain.
The paper offers a way to close this debate with five calibration protocols. Per-class double-log regressions (if the functional form is right, linearity itself is the test, and gamma and kappa-L(w)/kappa-M are recovered), per-component marginal quality per dollar curves at two or more tiers, pass-at-k reliability curves at a fixed frontier, a 2x2 factorial (tier low/high times harness bare/full) at a fixed total budget, and the quarterly re-solve. It also states three results that would falsify it together. If gamma is near zero across classes, the interaction disappears and a single global frontier suffices. If all m_i are monotonically increasing and tier-independent, the break-even never fires below the frontier, and the simple policy of buying both levers uniformly is the right answer. If the frontier keeps the harness lead within the observed price window, the model-upgrade condition becomes vacuous, and the contribution reduces to harness pricing. All three are allowed outcomes, and none of them is a failure of the protocol.
The operating conclusion is one sentence. A weak model is not a cheap tier that comes with risk, but another point on the same frontier. The question is not which lever to buy, but which lever has higher marginal quality per dollar right now, and it must be re-solved every time prices drift.
The full paper and data are available on Hugging Face. thaki-AI/daily-paper-2026-08-20-harness-scaling-cost-quality-frontier