A Better Worker or a Better Scaffold: Six in Ten Performance Swings Come From the Scaffold
When you run an unattended agent for a long time, the same question keeps coming up: buy a better model, or fix the code wrapped around it. We measured it, and more than half the answer sat on the code side, not the model. If you own the budget or the design for agents like this, this post puts numbers on that tradeoff.
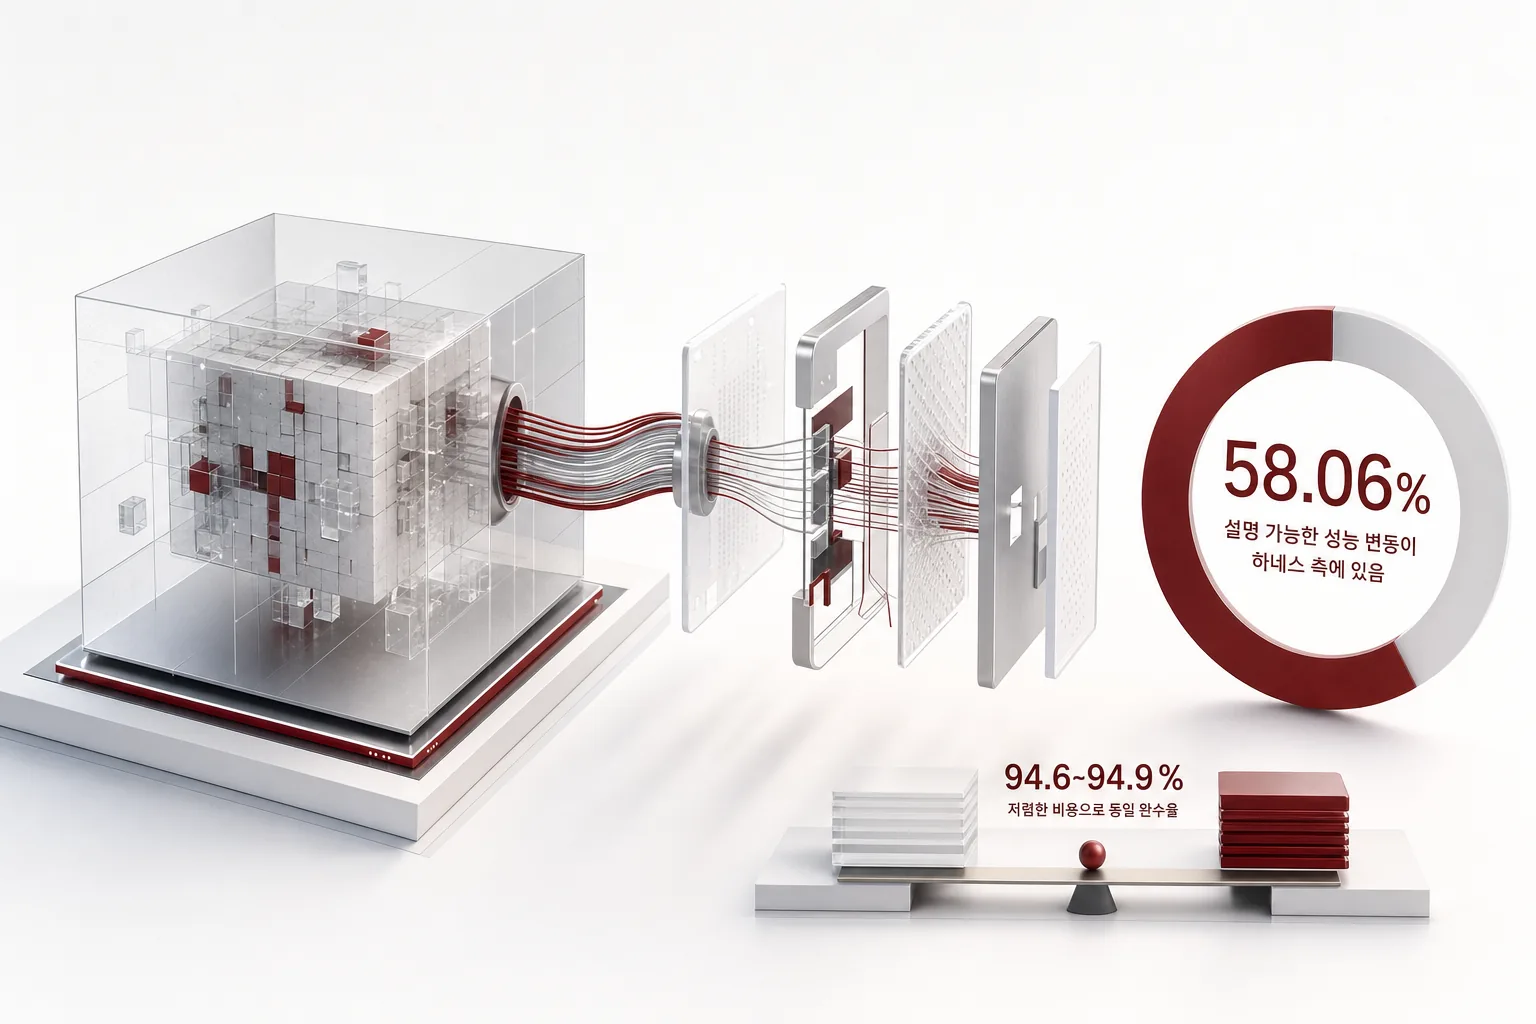 An illustration of the core idea.
In plain terms
Picture a construction site. A fast pair of hands matters, but so does the scaffold that worker stands on. A weak scaffold eats up time no matter how fast the hands are.
Agents work the same way. If the model doing the work is the worker, the code that catches its mistakes and lines up the next step is the scaffold. We call this scaffold a harness.
Plenty of reports have said fixing the scaffold made things better. But nobody had measured how much better, or how that compares with hiring a stronger worker instead. This experiment is that measurement.
What we did
Reports from the past year all tell a similar story. One team finished a task for about 15 dollars, while a reference setup for the same task cost over 30 times more, around 575 dollars. Other reports also credit a fixed scaffold for a big score jump. None of them separated how much came from the scaffold and how much from the worker, meaning the model itself.
So we set out to measure it directly. We built 15 long-horizon tasks that must be done in a fixed order. Each task has 10 to 18 steps that must be finished, and running a later step before its prerequisite finishes triggers a clear error.
For the worker, we used three tiers: strong, medium, and weak. A weaker tier is cheaper but also more likely to pick the wrong next step.
For the scaffold, we built five styles. The first has no safety net at all. The second is a check step that catches a mistake right after it happens and fixes it on the spot. The third is a check step that blocks a mistake before it happens. The fourth is a running ledger that keeps only the information it truly needs. The fifth keeps the last few lines in full detail and summarizes the rest.
Mixing three worker tiers with five scaffold styles gives fifteen combinations. We ran each one 32 times over the 15 tasks, 480 runs per combination, 7,200 runs in total. The worker’s skill is a simulated stand-in calibrated to published scores rather than a real model call, and the paper says so plainly. The scaffold’s code, the time it took, and the cost are all measured from real runs. In plain terms, the worker’s skill is an assumption, while the scaffold’s effect and cost are measured facts.
What came out
Six in ten points came from the scaffold side
Splitting task completion statistically, worker tier alone is the single largest factor. But add the scaffold’s own effect to the effect it produces together with tier, and it claims 58.1 percent of the explainable variance. In plain terms, six out of ten reasons we can explain sit on the scaffold side.
The effect scaffold and tier produce together is almost as large as the scaffold’s own effect. That means whether a scaffold style works depends on how strong the worker already is. A test that only flips one scaffold on and off misses exactly this part.
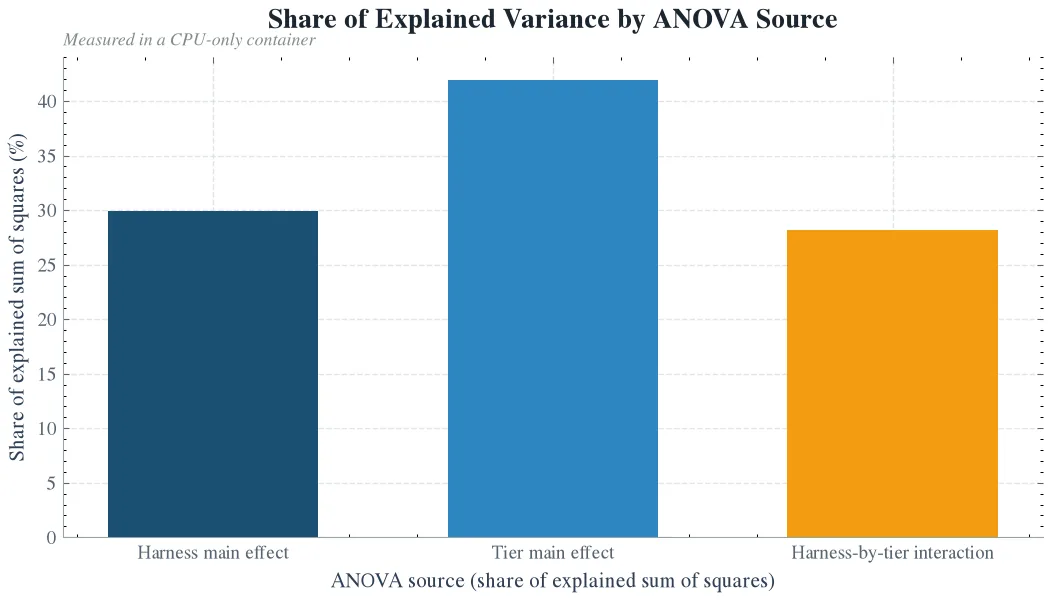 Model tier is the larger single main effect, but the harness main effect and the harness-tier interaction together claim 58.06% of the explainable variance, the harness leverage share. In this design, model tier is a simulated proposer calibrated to published accuracy and the harness is real control-flow code; the numbers are measured on CPU-only containers.
Still, the part statistics can explain is only 22.1 percent of all the change. The rest comes down to how hard the task itself is. In plain terms, scaffold effects show up mostly on hard tasks, and the overall completion rate depends heavily on which tasks you throw at it.
Check steps buy completion, ledgers buy tokens
Splitting the five scaffold styles into a completion channel and a cost channel shows each one does its main work through a different route. The clearest contrast sat in the weak tier, since the strong tier already finishes almost everything even with no scaffold at all.
In the weak tier, the plain scaffold finished a little over six out of ten runs. Both check steps, the one that fixes a mistake after it happens and the one that blocks it beforehand, finished all ten. The ledger and the summarizing style showed no meaningful gain over the plain scaffold. In plain terms, only the two check steps reliably lifted completion.
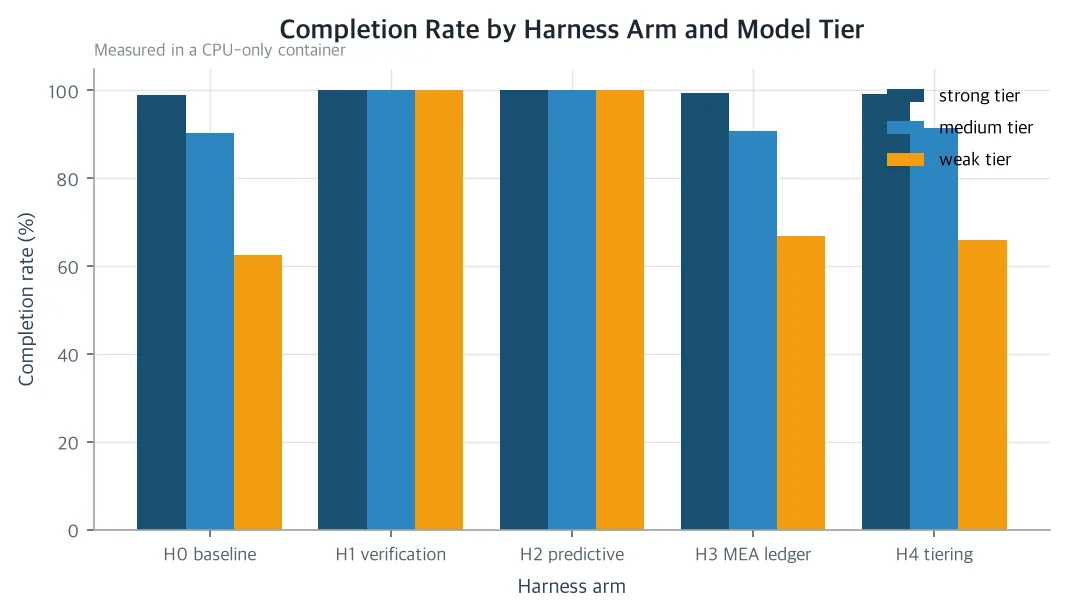 The deterministic verification gate (H1) and the predictive gate (H2) raise weak-tier completion rate from 62.50% to 100.00%, while the MEA ledger (H3) and memory tiering (H4) show no statistically meaningful difference from baseline. In this design, model tier is a simulated proposer calibrated to published accuracy and the harness is real control-flow code; the numbers are measured on CPU-only containers.
The cost story is different. The ledger style cut tokens by nearly a sixth in the weak tier, and cost fell by the same amount. But its completion gain was small. The summarizing style did the opposite: it still overshot the weak tier’s information limit, so it neither raised completion nor lowered cost.
The two check steps buy completion at a small cost premium: roughly 2 to 7 percent more in the weak tier and 8 to 9 percent more in the strong tier. In plain terms, no single style won on both completion and cost at once. That is exactly why combining a check step with a ledger is a natural next experiment.
One combination runs for under a cent
Prices spread twenty-five fold and completion rates only range from 62 to 100 percent. But look at how many runs finish out of a thousand attempts, and the gap widens to nearly twenty fold. Across the fifteen combinations, tier sets the price and the scaffold decides how well it performs inside that price.
Pairing up tier-and-scaffold combinations that finish about equally often and comparing their price, the cheaper side was always a weak tier fitted with a check step. Measured savings run close to 95 percent, roughly twenty times cheaper. In plain terms, if you want the same completion rate, fitting a cheap worker with a check step beats hiring an expensive worker by a wide margin.
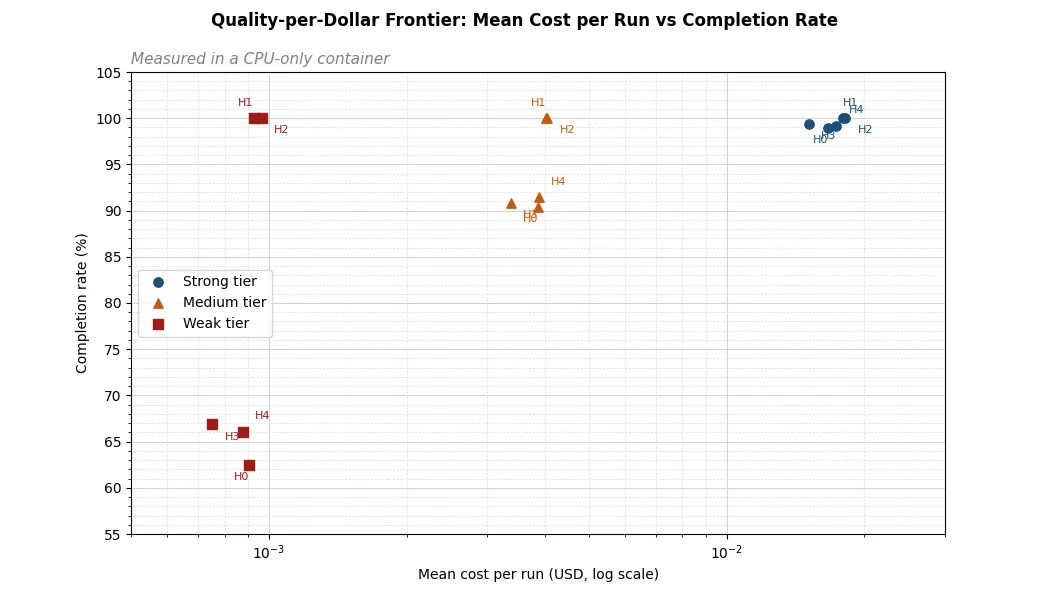 Measured 15 (arm, tier) cells form three cost bands by tier, and gated weak-tier cells reach 100% completion at under a cent per run, roughly 20x cheaper than their strong-tier counterparts. In this design, model tier is a simulated proposer calibrated to published accuracy and the harness is real control-flow code; the numbers are measured on CPU-only containers.
What to change
First, fix the scaffold code before buying a new model. Adding just one check step let the weak tier finish exactly as often as the strong tier.
Second, cost-only styles like the ledger or the summarizing scaffold do not fit work where completion is what matters. They are useful for work where saving tokens is the goal instead. Decide which goal you are optimizing before picking a style.
Third, the next experiment should combine a check step with a ledger, since no single style in this run won on both completion and cost at once.
Fourth, this turns “where do we spend money” into a measurable question. Investing in the scaffold pays off before buying a pricier model, and it also means smaller teams can reach comparable quality without an expensive model tier.
What not to trust
The worker’s skill is a simulated stand-in calibrated to published scores, not a real model. So the absolute gap between tiers comes from that calibration, while only the scaffold’s effect and cost numbers are truly measured.
We only tested one family of tasks that must run in a fixed order. Open-ended or state-heavy work could behave differently. The specific thresholds built into the check steps are design choices, not tuned values.
The check steps in this design are rule-based and never call an AI model, so they cost nothing to run. That means the near-95-percent savings is a best case for what a realistic check step could achieve. A real verification step is itself a model call, so it spends its own tokens and gets less reliable as the tier gets weaker. In plain terms, this number shows the best case, and using it for real work would likely narrow the savings.
Timing excludes network delay from calling a model, and the confidence intervals assume independence between runs. The single biggest fact left standing is that most of the leftover variance comes from how hard each task is, not from the scaffold or the tier.
Paper detail page: https://thakicloud.com/tech-blog/en/research/harness-leverage-model-harness-attribution/
Figures come from 15 long-horizon tasks across 7,200 measured runs. The body rounds for readability; exact values stay in the figure captions. Worker skill (model tier) is a simulated stand-in calibrated to published accuracy; the scaffold’s (harness) code, cost, and timing are all measured values.