There were seats. There was no ledger: measuring the fallback tax
There were seats. There was no ledger. This post is for you if you are a Korean cloud or AI engineer who runs multi-cluster LLM serving or sets a cost budget for when the fast tier saturates. Today’s paper measures the price and latency of three paths: the queue, the slow in-house tier, and the commercial API. How much you pay when the ledger does not know that empty seats exist is the question, and the paper answers it with measured numbers.
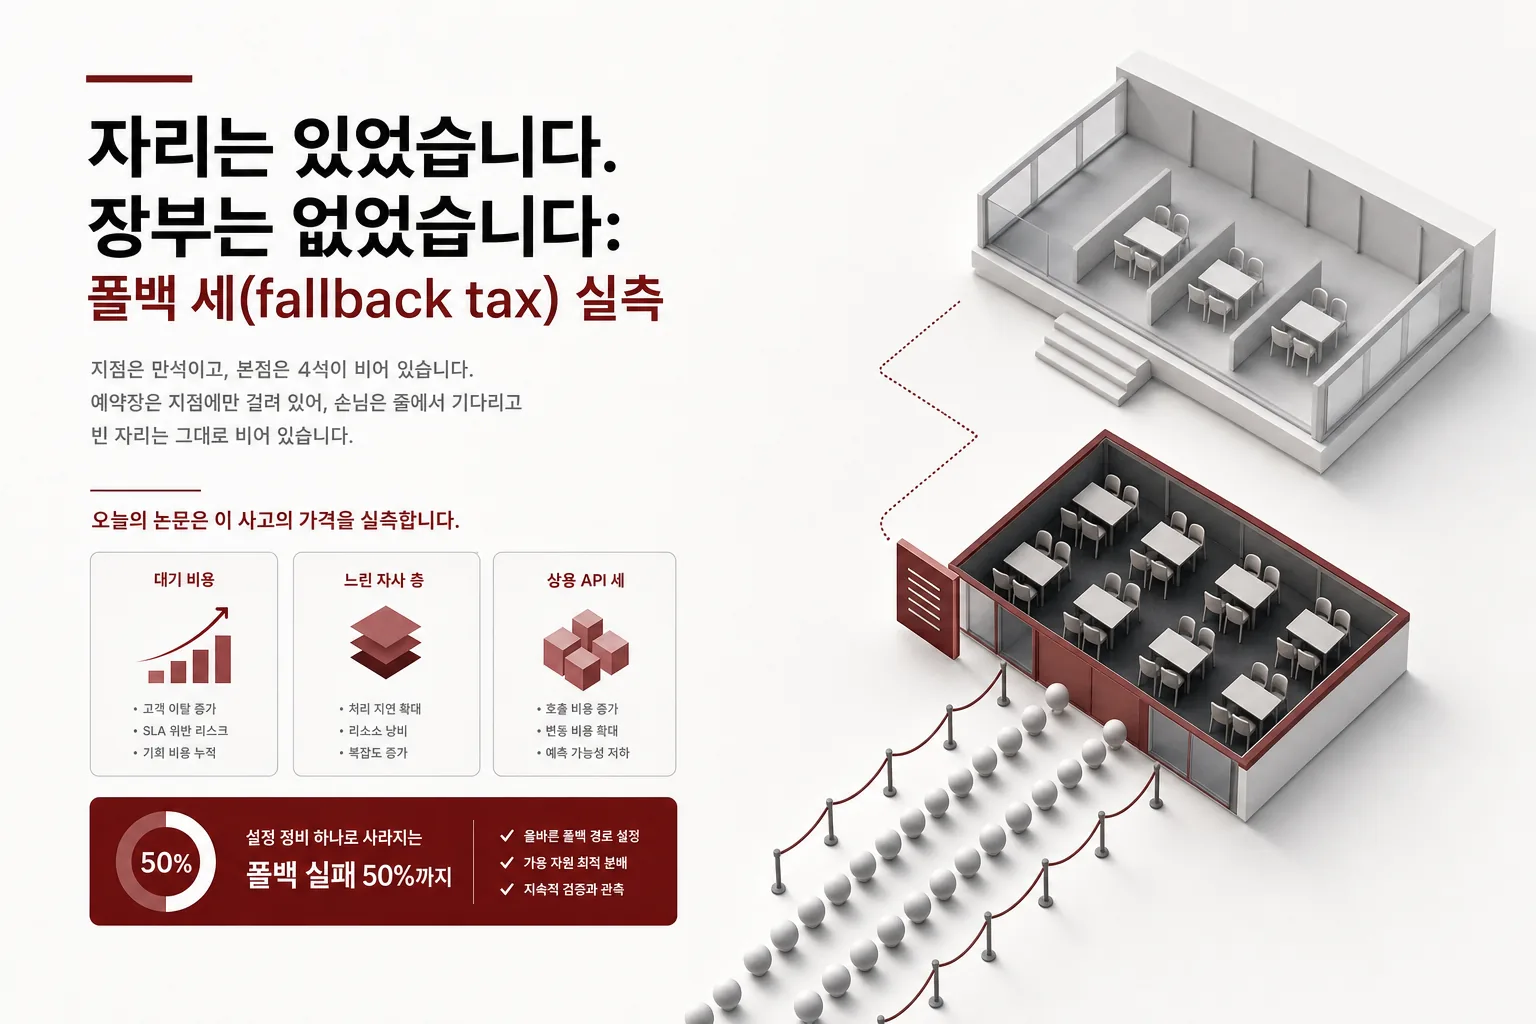 A visual metaphor for the article’s key idea.
In Short
Think of two restaurants. One is a branch, the other is the headquarters. The branch has expensive seats but the food comes out fast. The headquarters has cheap seats but a long wait. Both are stores of the same company. The one that is often overbooked is the branch.
When the branch’s reservation book is full, a customer picks one of three paths. They join the branch line. They move to the headquarters. Or they order delivery, or go to a different restaurant altogether. The paper’s three paths are exactly this choice. Joining the line is waiting in the fast tier. Moving to the headquarters is offloading to the slow in-house tier. Ordering delivery is offloading to the commercial API. Fallback is the name for all three paths together.
The fallback tax is the extra money you pay when you take the expensive path without knowing the cheaper one exists. Joining the line is free. But if a seat frees up late, the value you lose by failing to process that request in time becomes the cost. If you order delivery, the markup above the headquarters price becomes the cost.
Here is the mistake. The headquarters has four empty seats. But the reservation book hangs in only one copy, at the branch. The staff tell the customer the headquarters is full too. The customer waits in line. The empty seats stay empty. The ledger not knowing about empty seats does not mean there are no seats. In the paper’s terminology, this is a fallback misfire.
What We Tried
This analogy came from a real incident. On September 2, 2026, the fast tier of our fleet, the B200, was full in one cluster by using all 8 cards. At the same time, the H100 tier meant to be used as fallback sat idle in a neighboring cluster with 4 cards unused. That is because the fallback queue (LocalQueue) was enabled on only 1 of the 2 clusters. Requests from the full cluster had no path to the idle H100s. Requests waited in line, and the empty cards stayed empty.
The paper prices these three paths. The slow in-house tier is measured. We ran the Qwen3-4B model on a single H100 NVL card. We processed 64 output tokens per request at 1, 2, 4, 8, and 16 concurrent requests. We also set two performance criteria. Total latency per request within 20 seconds, and latency per token within 100 milliseconds. Both are service level objectives (SLOs).
Waiting in the fast tier is hard to measure directly. Once all the cards are used, it is difficult to hold that state and measure the waiting cost. So we treated the queue path as a cost model. Because Kueue’s reservations are per job, the GPU cost of an additional request joining the line is 0. The only cost of waiting is the value you pay when a seat does not free up within the SLO.
We price the commercial API from published rate cards. The baseline is 4 small models and 1 frontier-class model, checked on OpenRouter on September 3, 2026. Combine the three pieces, the measured slow tier, the modeled queue, and the rate-carded API, and you get a break-even map for when the fast tier saturates. Break-even research so far only valued things inside a single cluster. This map prices the fallback decision that moves across tiers and clusters. It is the first map priced with measurements.
The Results
The measured results for the slow in-house tier are the center of the paper. The total output of a single H100 NVL grows almost linearly as concurrency increases. Output that was 15.0 tokens per second at 1 request rose to 260.9 tokens per second at 16 requests. At 4 or more requests, the time per request held 3.9 seconds within 1 percent. In human terms: 16 customers sat at the same time, yet each got their food at the same time, and the meal cost per person fell to less than one sixteenth.
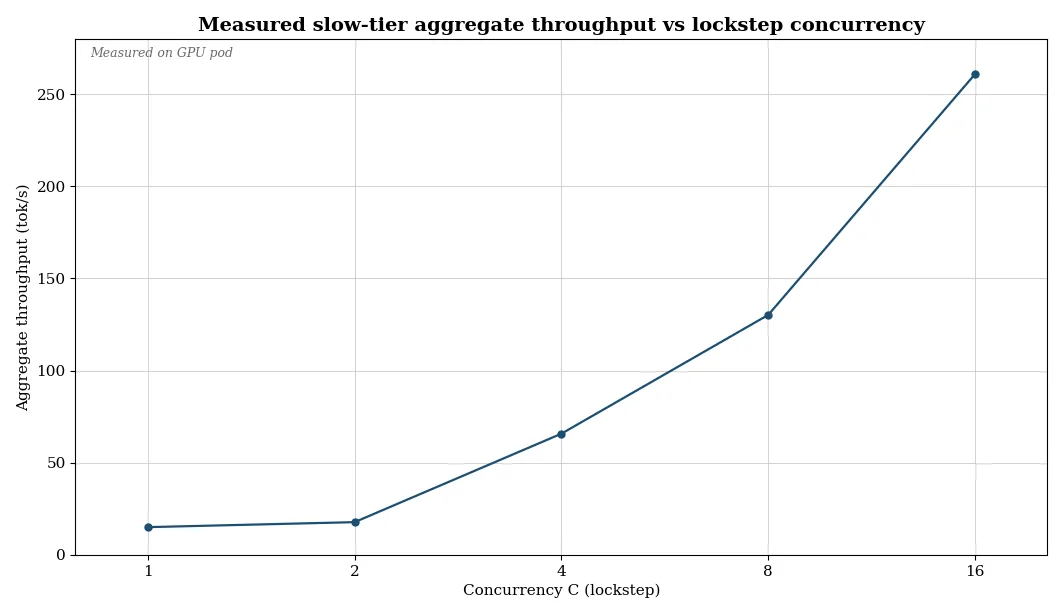 The aggregate output of a single H100 NVL card grows almost linearly from 15.021 to 260.898 tokens per second as the number of concurrent requests C increases from 1 to 16. At C=4 and above, the processing time per request holds within 1 percent of 3.9 seconds. C=2 is the only point that exceeds the per-token latency criterion. Measured values from a GPU pod on September 2, 2026.
Cost moves in the same direction. The unit output cost, summed over a full GPU hour, starts at $46.2 per million tokens at 1 request and falls to $2.7 at 16 requests. The cheapest point is 16 requests, the same point as the maximum that can satisfy all the SLOs. 2 requests is the outlier. Total output is higher than at 1 request, but the latency per request exceeds the 100-millisecond criterion at 112.7 milliseconds, violating the per-token latency SLO. We read it as an artifact of the lockstep measurement method that fires all concurrent requests at once. In the policy, it is treated as an SLO-missing point.
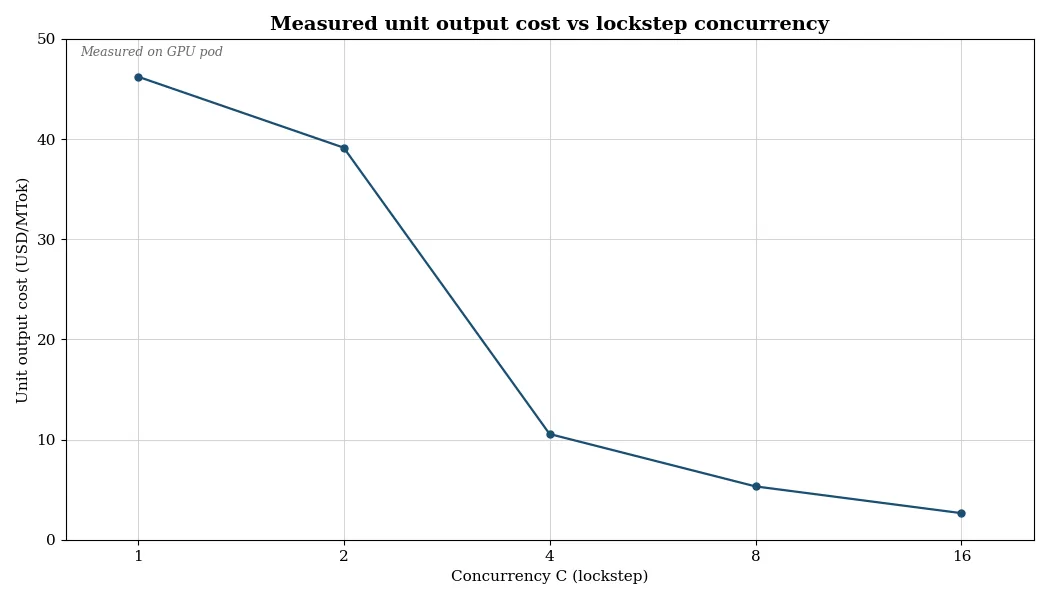 The unit output cost, summed over a full GPU hour, hits its lowest point of $2.661743 per million tokens at C=16. C=2 is the only point that exceeds the per-token latency SLO (100 milliseconds), at 112.72 milliseconds. Measured values from a GPU pod on September 2, 2026.
We pit these measured values against the public rate cards. If we take the cheapest SLO-safe value for the slow in-house tier, $2.7 per million tokens, as the break-even point, the 4 small-model APIs are 4 to 20 times below it. The 1 frontier-class model is about 2.3 times above it.
| Endpoint | Class | Output price ($/million tokens) |
|---|---|---|
| qwen/qwen3.7-flash | Small | 0.13 |
| mistralai/ministral-8b-2512 | Small | 0.15 |
| meta-llama/llama-3.2-1b-instruct | Small | 0.20 |
| openai/gpt-4o-mini | Small | 0.60 |
| x-ai/grok-4.6 | Frontier-class | 6.00 |
The values in the table are the OpenRouter public rate card as of September 3, 2026. On price alone, the commercial API undercuts our slow tier by an order of magnitude for small models. Our in-house cost is priced against list prices, so it is higher than the true internal cost. That makes this comparison conservative on the API side.
We priced the fallback misfire separately. Let r be the fraction of clusters with the fallback queue enabled. Under uniform routing, the fallback misfire probability is 1 - r. Before the fix, only 1 of the 2 clusters had it enabled, so it was 50 percent. The fix was correcting Kueue’s cluster-scoping configuration. After the fix, it is 0 percent.
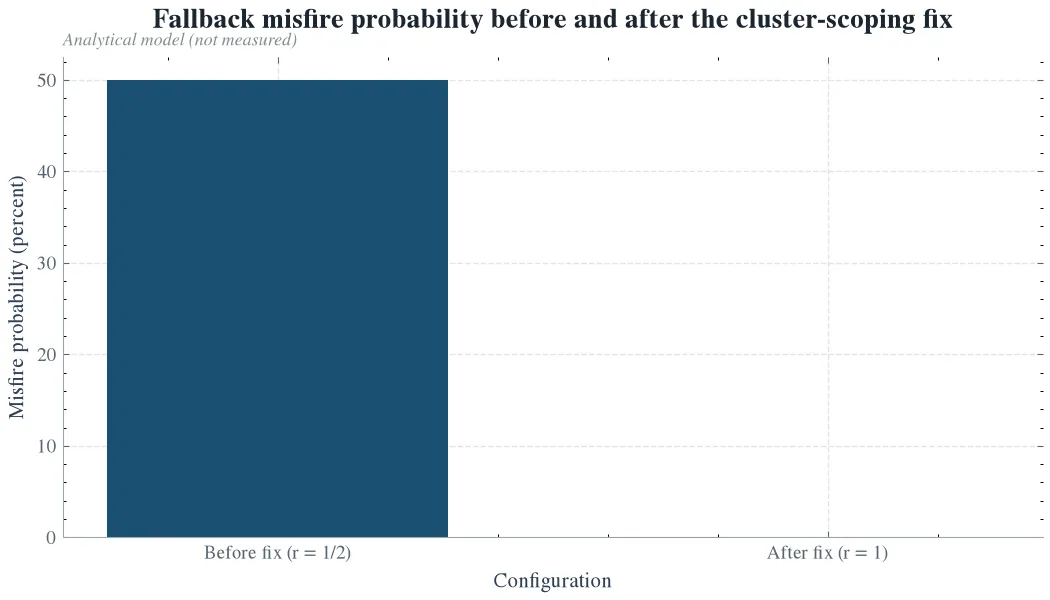 The fallback misfire probability is 1 - r. r is the fraction of clusters with the fallback queue (LocalQueue) enabled. Under uniform routing, 1 - r of the requests land on clusters with no fallback path. Before the Kueue cluster-scoping fix, r = 1/2 for 50 percent; after, r = 1 for 0 percent. This is a calculation from the analytical model, not measured data.
In the worst case, a request that hits a fallback misfire loses the cheap path entirely. You lose the full value of that request. In human terms: half the requests waited in the branch line, or bought expensively elsewhere, even though the headquarters had empty seats. That difference is the fallback tax.
So What Should You Change
The third contribution of the paper is the rule that makes this map work. When the fast tier is full, the fallback policy picks the paths in order.
First, wait in the line if the fast tier’s seats will free up in time. Joining the line is free, so this is the cheapest path. Second, before moving to any fallback path, check whether the fallback queue is enabled on that cluster. If it is off, treat it as a configuration incident, not a request incident. Third, if the API for the same model is within 10 percent cheaper than the measured value, or if the slow tier has no headroom, offload to the API. Fourth, send the rest to the slow tier. Requests where the data must stay in-house go to the slow tier no matter how cheap the API is. Fifth, requests that fit no path wait in the fast tier line, and that loss is written into the cost ledger. There is no path to quietly drop them.
Every threshold in this policy is a number priced today. The cheapest point and the SLO maximum point coincide at 16 requests. The unit cost is $2.7 per million tokens. And the ledger check that brought fallback misfires to 0 percent runs on every request.
What this leaves for the company is that the rule can be switched on in the fleet immediately. Our token factory is made of three tiers: B200, H200, and H100. The price of the point where this incident happened has been fully priced today. The gap in the ledger was filled by the fix.
What this leaves for the broader field is that the value becomes visible. Fast-tier GPUs are becoming shared infrastructure used by many companies. This is a market where when it fills up is the question. A small operator can compute their fleet’s break-even point in the way of this map. So runaway agent workloads settle into the slower, cheaper path instead of getting blocked or over-billed. Requests finish, and the cost is readable per request.
What this leaves for science is the first measured map and the first incident type. This is the first study to price the cross-tier fallback decision under real fast-tier saturation. The fallback misfire is an incident type created by a gap in the ledger, priced from 50 percent to 0 percent around the fix. Where earlier research priced which configuration is cheap inside each tier, this map is the outer loop that prices which request goes to which tier and which cluster. Put the two together and the break-even problem that spans inside the tiers and between them closes.
What Not to Trust
The measurement comes from a single card and a single model: an H100 NVL with the 4B-class Qwen3-4B. The H200 and B200 tiers, and larger models, have their own maps. As the model grows, the token-by-token generation stage becomes memory-bound, and the in-house tier’s price gets closer to the API’s price. At some size the break-even point flips, in the direction of the in-house tier becoming cheaper.
The measurement method also has limits. This measurement fires all concurrent requests at once. A real service processes a continuous stream of incoming requests. So even though the cheapest point comes out at 16 requests, the value can go lower at higher concurrency. The 2-request outlier is partly a trace of this measurement method too.
The input is short. The output is fixed at 64 tokens. Workloads with long inputs or a lot of long-form writing drift from these values. The API prices are as of September 3, 2026. Inference market prices keep falling, so the break-even point is a moving target. The policy’s 10 percent margin is there to absorb that movement.
The queue path is a model. Because the fast tier was physically full, we could not price the waiting distribution under saturation. The fallback misfire is also a single real incident plus a ratio calculation. Under uniform routing, 1 - r is exact, but the loss across the whole fleet is something to price with a large-scale trace.
What transfers is the shape. The fallback misfire can be cut in half by a single configuration fix. The prices of the three paths can be priced with measurements.
You can read the paper detail page here: The Fallback Tax: Measuring Queue-vs-Slow-Tier-vs-API-Offload Break-Even Points for LLM Serving When the Fast GPU Tier Saturates Across Clusters
In the body, values like 260.898 are rounded to one decimal place. Of the three paths, the slow in-house tier is a measurement on real hardware from September 2, 2026. The queue path is a cost model because the fast tier was physically full. The API path is based on the public rate card as of September 3, 2026.