Unattended Agent Loops Don’t Fail, They Weaken: The Endurance Wall Seen Over 72 Hours
This post is for Korean cloud and AI engineers who run unattended agent loops on overnight schedules, or who review the reliability of platforms that run such loops. The paper answers one question: how many hours can you trust that loop? Not “does this task succeed?” but “how long can you trust it?”. Existing agent benchmarks all answer the former on minute-scale horizons. Nobody answers the latter. The missing axis is elapsed unattended time. This paper makes it a first-class failure axis, and calls the moment when a loop’s independently verified task success rate falls below the operational quality floor (0.90) the endurance wall. A loop past the wall keeps producing output. Just output that no longer passes verification. And it does not tell you that it has crossed the wall. That is exactly the failure mode overnight deployments fear most.
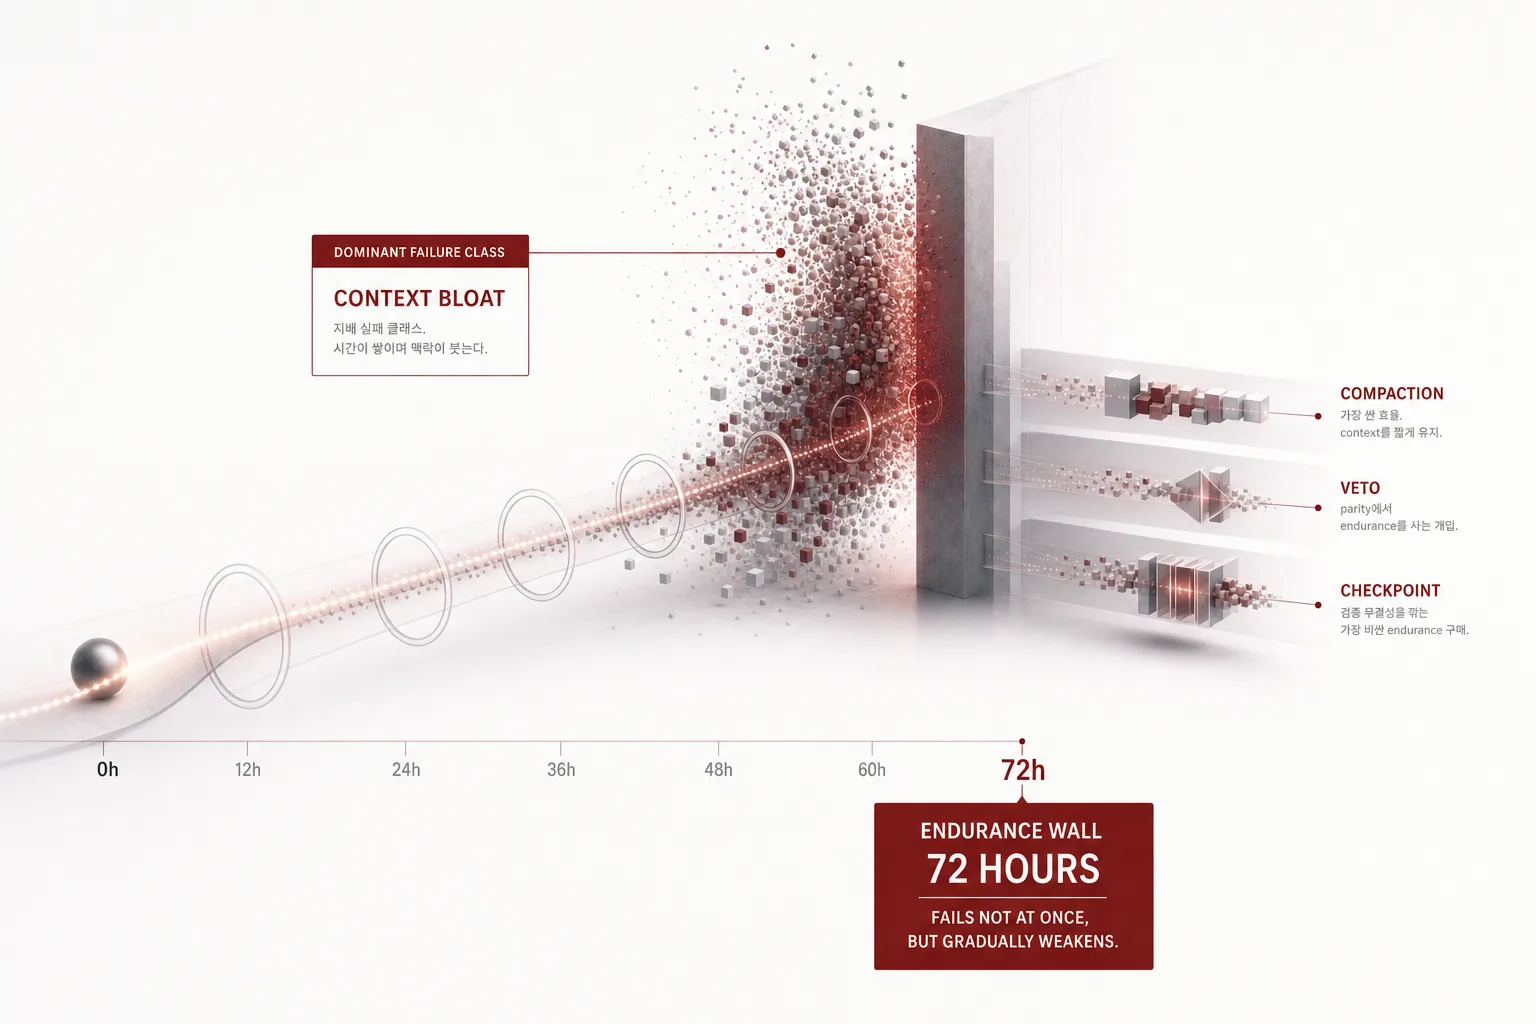 A visual metaphor for the article’s key idea.
The Unmeasured Axis: Elapsed Time
Business-automation agents are increasingly running unattended. A loop starts over a fixed task stream and is left for hours with no human on the control path. In such deployments, the natural reliability question is not “does this task succeed?” but “how many hours can I trust this loop?” Agent benchmarks answer the former on minute-scale horizons. Per-task success rate on a fixed suite, or end-to-end completion of a single workflow. Nobody answers the latter, because there is no measurement of just letting a loop run.
This paper asks about the latter through three research questions. RQ1 (decay): does verified task success rate fall with elapsed unattended time, and how fast at each hazard level? RQ2 (taxonomy): what is the failure breakdown at each horizon, and does it change as the loop ages? RQ3 (interventions): at fixed task quality, how many hours of endurance does each intervention buy? There are three candidate interventions: periodic context compaction, checkpoint-and-restart, low-confidence veto escalation, and all their combinations. Price is set in quality-per-dollar, QPD. That is pricing a reliability investment under fully metered token accounting.
| Before measuring, it defines the quantities. Every task’s output is judged by an independent verifier. Mechanically checkable verification, not the loop’s own declaration. The rolling verified success rate S(t) is the success rate over a 24-task window (2 hours at 12 tasks/hour), sampled hourly. Endurance is the elapsed time at which S(t) first drops below the pre-fixed floor of 0.90. That is the definition of “trustworthy unattended runtime on the floor”. Unrecovered failures are each assigned to exactly one terminal class: context bloat (context exceeding the task budget is the cause), retry cascade (the retry ladder exhausted on propagated failures), silent no-op (reported as completed but no verifiable state change), skill misroute (dispatched to an unsuitable skill or chain), resource starvation (transmission and compute contention push past the budget and it stalls), other. Error amplification is measured as the conditional failure gap, Δ_comp = P(task t fails | task t-1 fails) - P(task t fails | task t-1 verified OK). A gap above 0 means a bad task makes the next task fail more. Verification integrity is the apparent/verified gap, the time-averaged absolute difference between the loop’s self-declared completion rate and the independently verified success rate. Near 0, the self-report is usable as an operational signal. Large, and the output looks completed while failing verification. |
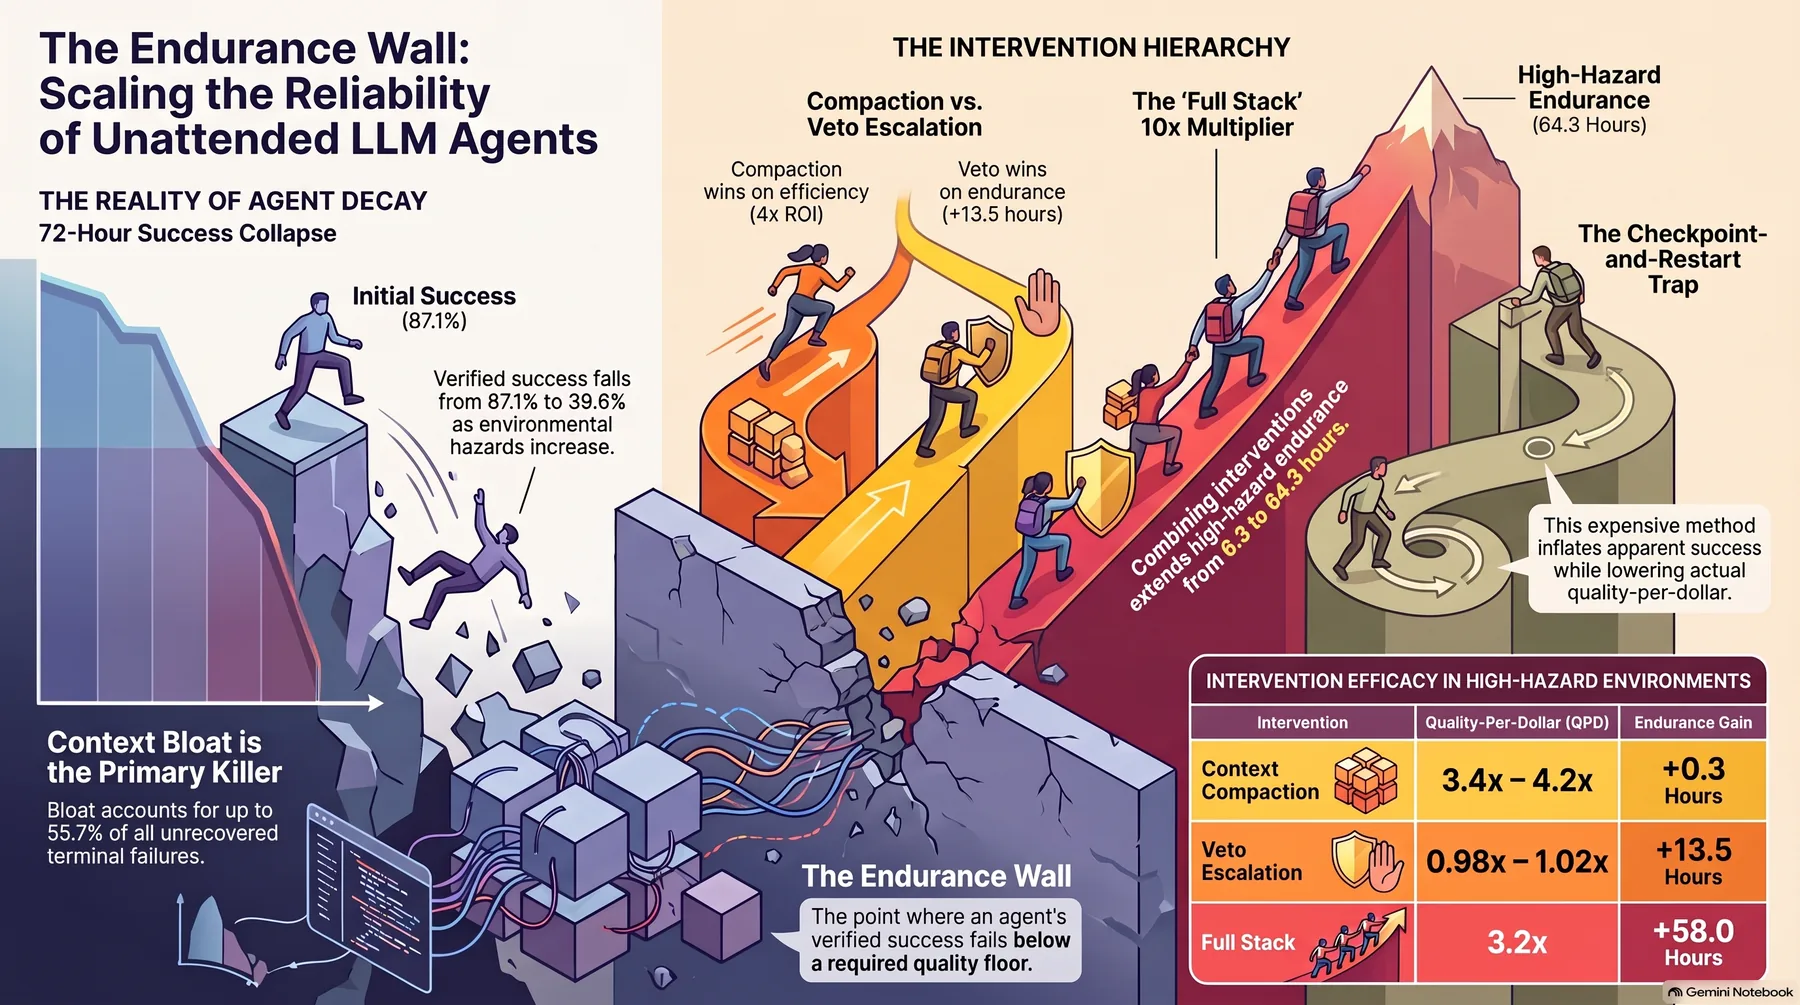 Infographic generated by NotebookLM from the sources.
Measurement Protocol: The Declared Hazard Grid and 8 Arms
The measurement uses a discrete-event simulator of the production harness. The task stream, skill registry, verifier, and retry policy are all frozen, and every arm shares the same single fixed self-hosted model tier. Differences between arms are therefore attributable to the harness intervention alone. Per-task model-behavior hazards (failure, misroute, no-op) are not fitted from telemetry. They are declared on a 3-level (low/mid/high) calibration grid that brackets per-task failure rates observed in unattended operation. The high level corresponds to the degraded days on which the loop breaks most often. A 24-hour demand cycle (half of the cycle is the peak window) quadruples the starvation hazard to model contention with co-located tasks. Context starts at 20,000 tokens, grows 6,000 tokens per hour (500 per task), and caps at 100,000 tokens. Horizon fixed at 72 hours, 12 tasks per hour, 864 per run, 100 seeds per cell.
The 8 arms are as follows. none (no intervention). compact (periodic context compaction every 6 hours: the transcript is summarized and rewritten at 0.5x token cost). checkpoint (state snapshot every 2 hours; when a task exhausts the retry ladder, 3 attempts with 50% success each, it restarts from the last good snapshot at a cost of 3,000 tokens and re-runs that task). veto (low-confidence veto escalation: when the loop’s confidence in a task result falls below the operational threshold, the result is vetoed at a cost of 500 tokens and the task re-run before it can contaminate downstream tasks). Plus the three pairwise combinations, compact+checkpoint, compact+veto, checkpoint+veto, and the full stack, all. QPD is total verified task quality divided by total metered cost (dollars). Self-hosted serving price for the frozen single tier is a constant across all arms, so all ratios are price-invariant.
The paper honestly declares the scope of this calibration. The hazard grid is declared, not fitted. It makes no claim that these curves are the telemetry of a particular production night. What the protocol measures is three things: (i) intervention mechanisms, (ii) the shape of decay under a monotone hazard schedule, (iii) the intervention ranking. The ranking is the property most robust to calibration, because the arms compete on the same grid. Anchoring the grid to production telemetry is exactly the next measurement. The discussion shows which results must be re-read once anchoring is done.
Decay: The Wall Arrives Within 24 Hours
In the baseline (no intervention), verified success rate falls monotonically with elapsed time at every hazard level. The linear decay slope steepens with hazard: -0.0015, -0.0031, -0.0079 per hour. The wall is crossed inside the 72-hour horizon at mid and high: endurance 29.1 hours (95% CI [26.1, 32.2]) and 6.3 hours ([5.1, 7.4]). Low barely makes it, at 56.4 hours ([52.9, 59.8]). Success rate at the 72-hour mark: 87.1% low, 75.7% mid, 39.6% high. The high-hazard loop is already below the 0.90 floor at the 24-hour mark, at 85.3%. It ends at 39.6%. A 45.7-point drop across the horizon.
Failure Taxonomy: The Wall Is a Single Material, Context Bloat
Two structural facts show up in the baseline terminal failure taxonomy. First, context bloat is the dominant terminal class at every hazard level (47.9%, 52.9%, 55.7%). It is also the dominant trigger (56.6~65.1% of all failure triggers). The loop dies more often from the state it builds itself than from anything external. Second, the rest of the mix is stable: skill misroute 12.8~13.3%, resource starvation 10.9~12.1%, silent no-op 9.4~10.0%, retry cascade at negligible levels for low/mid. The baseline’s wall is a single material: bloat.
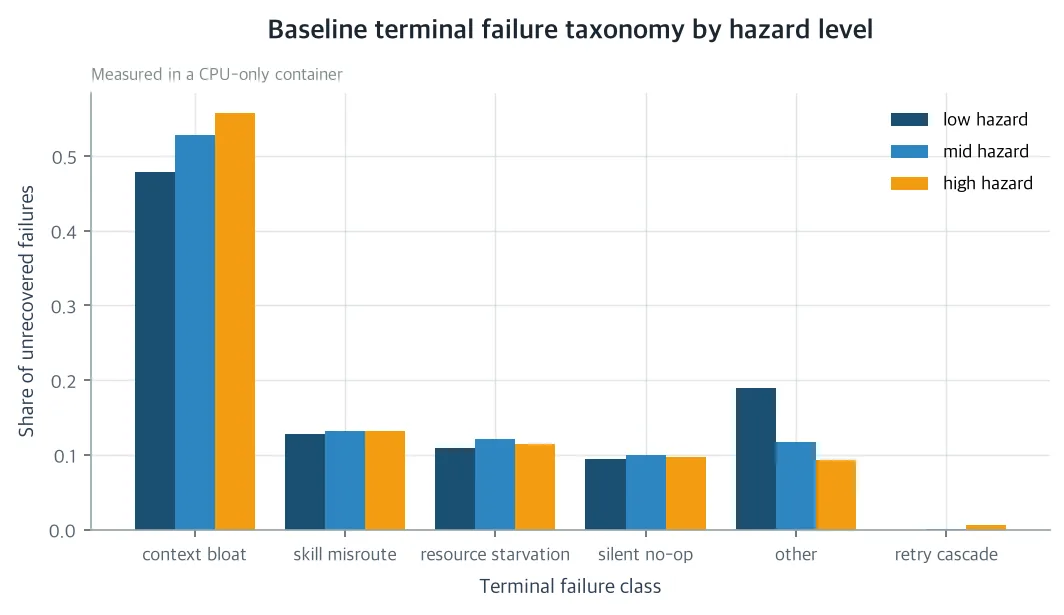 Terminal failure taxonomy for the baseline (no intervention). Context bloat is the dominant share of unrecovered failures at every declared hazard level, and the rest of the mix (misroute, starvation, no-op) is roughly stable. Results of a controlled 72-hour measurement (discrete-event simulator, declared hazard grid), not the telemetry of a particular production night. (measured on a CPU-only container)
Error amplification is measured and level-dependent. Baseline Δ_comp is +1.51pp (low), +3.72pp (mid), +14.22pp (high). At high hazard, the task after a failed task fails with probability 0.401, while the task after a verified OK task is 0.259. The amplification is mediated by state: the loop fails against its own degraded context. That is exactly the channel compaction must cut. And it does cut it, as the next section shows.
Under interventions, the taxonomy moves. When compaction removes bloat (55.7% → 2.4% under compact), the remaining wall is the stable mix: skill misroute at 33.0% and resource starvation at 28.1% become the leading classes. Under compact+veto, the starvation share climbs to 44.4%. Long-lived arms accumulate more peak-window exposure in the 24-hour demand cycle. That is a mechanical consequence of endurance, not a new failure mode. In the opposite direction, checkpoint arms concentrate the mix (bloat 65~79%). Restarts re-inflate context from the snapshot, and the loop’s aged state is only partially reset.
Intervention Ablation: Endurance and Efficiency Are Bought Separately
The first finding is compaction’s efficiency leverage. QPD ratios of 3.44, 3.60, and 4.17x at low/mid/high. The highest of all arms at every level. Mechanically, compaction removes the dominant terminal class (bloat 47.9~55.7% → 1.8~2.4%), and with it the failure trigger that drives retry cascade. Cascade exhaustion falls from an average of 1.55 ladder exhaustions per run at baseline (high) to 0.00 in every arm containing compaction. The conditional failure gap shrinks to +0.24/+0.88/+1.48pp under compact alone and to -0.29/-0.56/+0.17pp under all. At low/mid hazard, that means the task after a failure is more likely to succeed than the task after a verified OK: a repair effect. Compaction turns the loop’s failures back into independent samples.
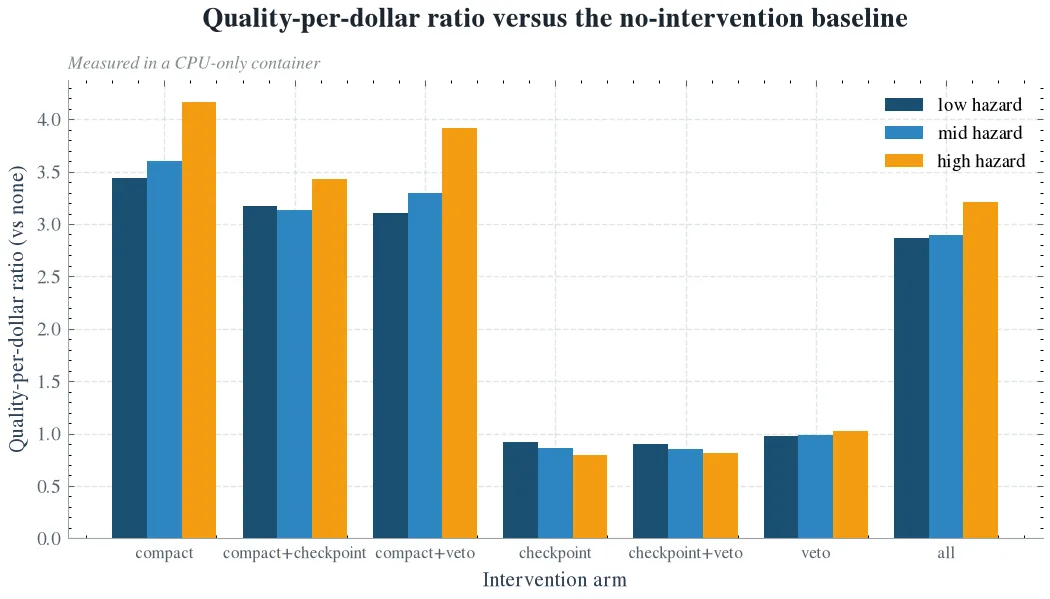 Quality-per-dollar (QPD) ratios against the no-intervention baseline. Every arm containing compaction is 2.9~4.2x more efficient than baseline at all hazard levels. Checkpoint alone and checkpoint+veto fall below parity. The two checkpoint+compaction arms (2.9~3.4x) sit above parity but below the compaction counterpart at the same level. Results of a controlled 72-hour measurement (discrete-event simulator, declared hazard grid), not production telemetry. (measured on a CPU-only container)
The second is the separation at high hazard. Compaction alone buys almost no endurance there (+0.27 hours). The wall is no longer bloat: it is the residual mix (misroute 33.0%, starvation 28.1%, no-op 23.9%), and compaction cannot touch it. The arm that scales at cost parity is veto. The only single intervention whose endurance gain grows with hazard while holding QPD at parity (+8.7 → +12.6 → +13.5 hours; QPD 0.98~1.02x). Checkpoint’s gain also grows with hazard (+3.5 → +6.5 → +8.1 hours), but it sits below parity (QPD 0.92~0.80x) and is smaller than veto’s at every level. Veto’s hazard scaling does not come from cutting the amplification channel. The conditional failure gap actually widens under veto (+14.22 → +15.31pp). Cascade exhaustion increases too (1.55 → 1.67 per run). What moves is the cheap cost per fixed intercept (500 tokens). As hazard rises, more results fall below the confidence threshold and get vetoed before contaminating downstream tasks. Total endurance gain grows, and the cost per intercept holds QPD at parity. The best single pairing, compact+veto, delivers +35.5 hours at high hazard for a QPD of 3.91x, at nearly zero integrity cost (A/V gap +0.31pp).
The third is the price of checkpoint. Checkpoint-and-restart is the most expensive endurance purchase, and it cuts verification integrity. Checkpoint adds endurance (+3.5/+6.5/+8.1 hours) but puts QPD at 0.92/0.86/0.80x of baseline. Restarts cost 3,000 tokens each and re-inflate context from the snapshot, so the terminal mix is not resolved. It reconcentrates on bloat (65.3%, high). The sharper finding is integrity. The apparent/verified gap moves from 0.7~2.9pp in the baseline to 9.0/15.1/21.9pp under checkpoint. Restarted loops “complete” more tasks that fail independent verification. Snapshot re-execution hides residual errors as completed work. Every arm without checkpoint keeps the gap at baseline level (under 2.9pp). The gap is a signature of the checkpoint mechanism, not of endurance. An operator reading completion rates will trust a checkpointed loop 9~22pp more than it deserves.
The fourth is the full stack. All stretches high-hazard endurance from 6.3 to 64.3 hours (10.3x). The 72-hour success rate holds at 0.953 instead of the baseline’s 0.396. At mid hazard, 29.1 → 69.9 hours. The QPD ratio (3.21x at high) is lower than compact+veto’s (3.91x) at every level, because the checkpoint component drags the stack’s efficiency down even while buying +22.5 hours more at high hazard. In short, compact+veto is the cheapest crossing of the wall (72-hour success 0.945, QPD 3.91x, integrity cost 0.31pp), and all is the deepest crossing (64.3 hours endurance, 0.953 at 72 hours, integrity cost 20.5pp).
The ranking is stable across the grid. Compaction is the top single arm by QPD at all three levels, and every compaction-containing pairing beats baseline at every level (at least 3.11x). The two checkpoint arms without compaction are below parity at every level (at most 0.92x). Veto’s single-arm endurance gain increases monotonically with hazard, and the endurance ordering all ≥ compact+veto ≥ checkpoint+veto holds at mid/high. The decay slope ordering is maintained for all arms containing compaction (down to -3.1x10^-6 ~ -3.0x10^-4 per hour at high). The wall does not move. It flattens by up to 26x.
What It Leaves for the Company, for Society, for Science
For the company (ThakiCloud), which already runs overnight unattended loops (skill evolution, paper pipeline, research lab) and sells work automation, the endurance decay curves and the per-horizon failure taxonomy give evidence-based numbers for “how much continuous runtime can be trusted without a human checkpoint”. And they rank which intervention to deploy first: compaction first, veto escalation second, checkpoint only when independent verification is inside the loop. Unattended reliability moves from hope to an operational dial.
For society, the promise of full business automation stands on unattended operation. Yet no public measurement existed of when, and why, a continuous agent loop running from hours to days silently degrades. Quantifying the endurance wall and the cheapest fix is a precondition for safely deploying unattended AI into the enterprise. It also cuts the wasted tokens and energy that failure cascades amplify into.
For science, agent reliability research to date has measured per-task success rates on short benchmarks. This paper introduces elapsed unattended time as a first-class failure axis: survival curves, per-horizon failure taxonomy, intervention ablation. It is the opposite dynamic from overnight evolution research, where the measured target is the improvement itself and overfit (train/holdout Goodhart shift, scaffold self-tuning). And one step up from long-horizon agent work that reports only end-to-end success rates without decomposing when and why the loop dies.
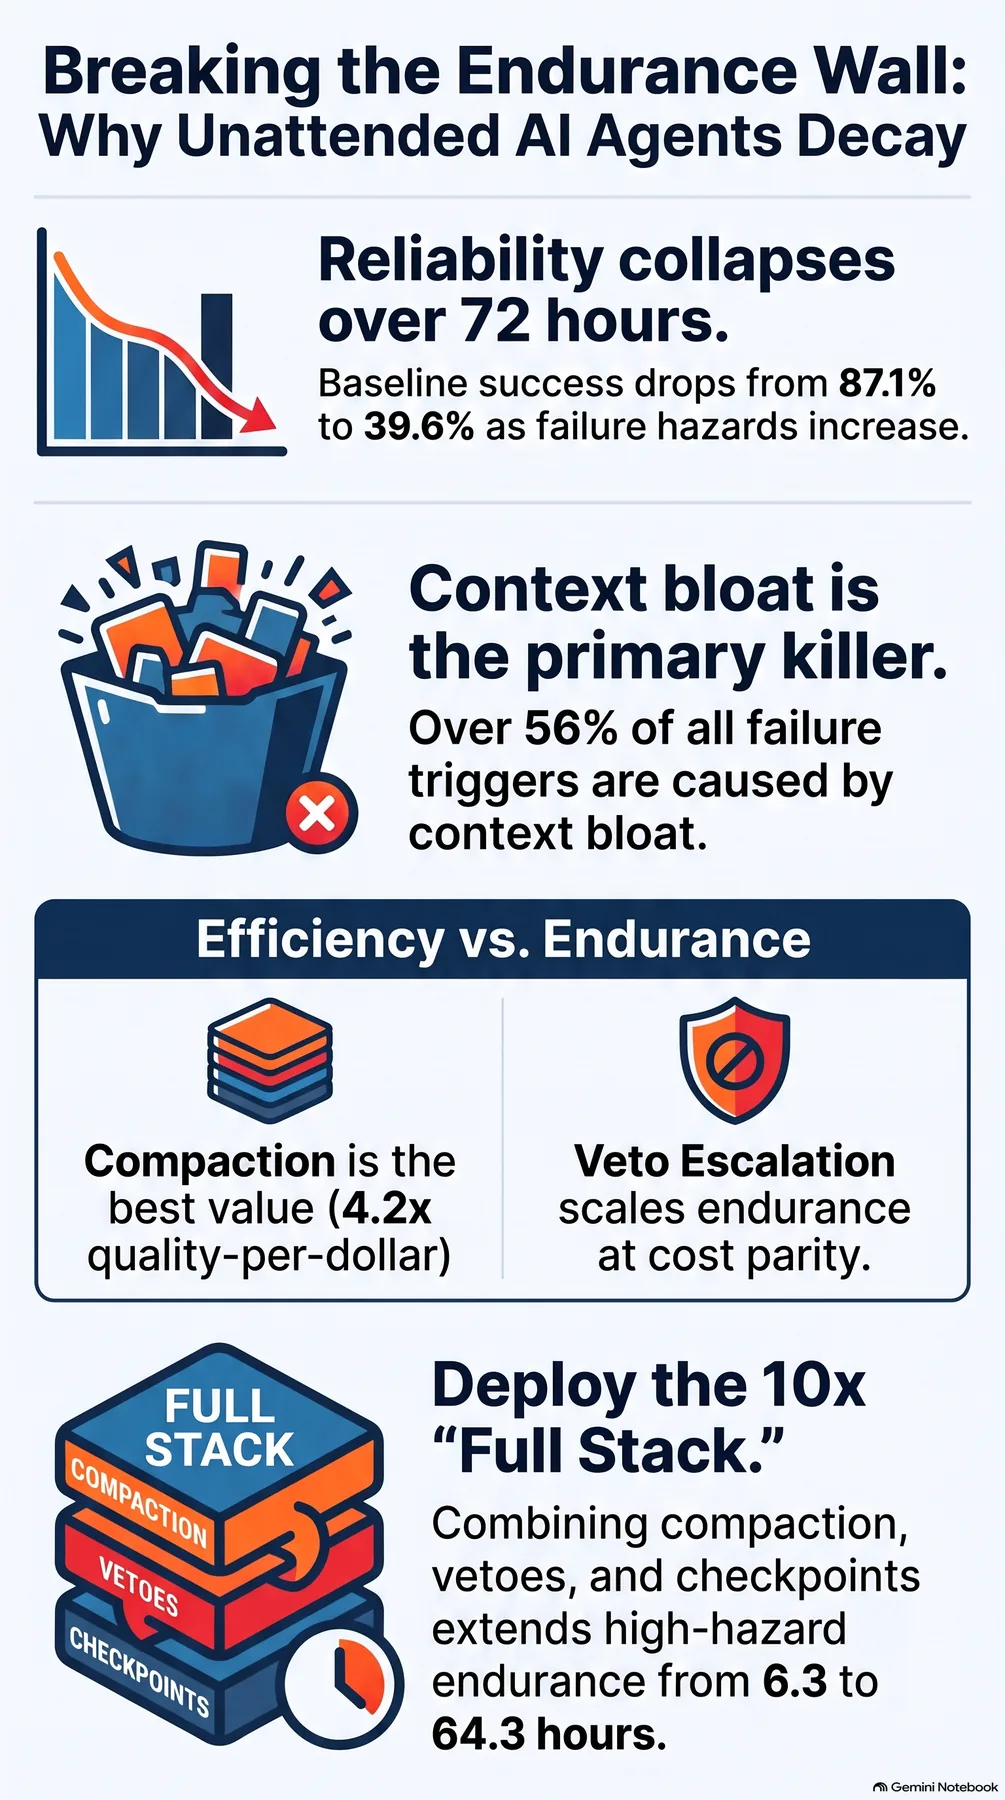 Infographic generated by NotebookLM from the sources.
What Still Cannot Be Trusted
There are six limits. First, the hazard grid is declared, not fitted. There is no telemetry fitting. Until the grid is anchored, the exact level results (the +35.5 hours compact+veto buys at high, against a baseline endurance of 6.3 hours there) can be called the cost of a “high-hazard night”, but not the cost of a “median night of the fleet”. The ranking results (compaction > veto > checkpoint in QPD, checkpoint’s integrity signature, compaction’s removal of amplification) are intervention mechanisms against a monotone hazard schedule, and should survive re-anchoring. Second, a single frozen task stream and a single model tier. Generalization across streams and across tiers is open. Prior factorial work only suggests that in this class of interventions, the harness-side effect dominates the tier effect. Third, the 72-hour horizon. The high-hazard wall may be a property of the first 24 hours rather than of 72 hours, and endurance beyond 72 hours is unmeasured. Fourth, the “other” terminal class (baseline 9.4~19.0%) is not decomposed. Fifth, 100 seeds per cell. The CIs on cell means are narrow (endurance half-width 1.1~5.2 hours), but the grid’s three levels are coarse. A finer hazard ladder would sharpen the endurance-gain curves. Sixth, the simulator’s verifier is deterministic and mechanically checkable, but if the verifier has its own error rate, the A/V gap numbers will move.
Future work: anchoring the grid to nightly telemetry (per-task hazard estimation), extending the horizon past 72 hours, ablating the residual wall (capacity-aware scheduling and retrieval-side skill coverage toward the starvation class), and testing whether live cost feedback works alongside the compact+veto stack. The QPD frontier of this paper is the natural input to its regulation.
The paper’s detail page is available here: The Endurance Wall: Reliability Decay, Failure Taxonomy, and Intervention Ablations in 24/48/72-Hour Unattended LLM Agent Loops
The two figures in this post are results of a controlled 72-hour measurement (discrete-event simulator, declared hazard grid), not the telemetry of a particular production night. The exact level numbers will move under telemetry anchoring. The ranking results will hold.