A P95 of 180ms Proves Nothing: How to Make Performance Numbers Trustworthy
Have you ever run the same load test twice and gotten two different numbers? This piece is for engineers who look at performance numbers every day and use them to decide whether to ship a release or scale up a fleet. There is one thing to take away: a performance metric like latency or throughput is not a fact you observe about nature, it is the outcome of a choice about what to measure, and if that choice is never written down, the number becomes a meaningless string six months later.
Here is the conclusion up front. Most of the time a benchmark lies, the cause is not a broken tool or a dishonest engineer. It is that whoever designed the measurement never explicitly stated what they were trying to measure. The procedures for picking a metric, controlling the environment, and reporting the result all exist as prose and nowhere else, and rules that live only in prose collapse first on the busiest day, precisely when the resulting number ends up driving the most consequential decision.
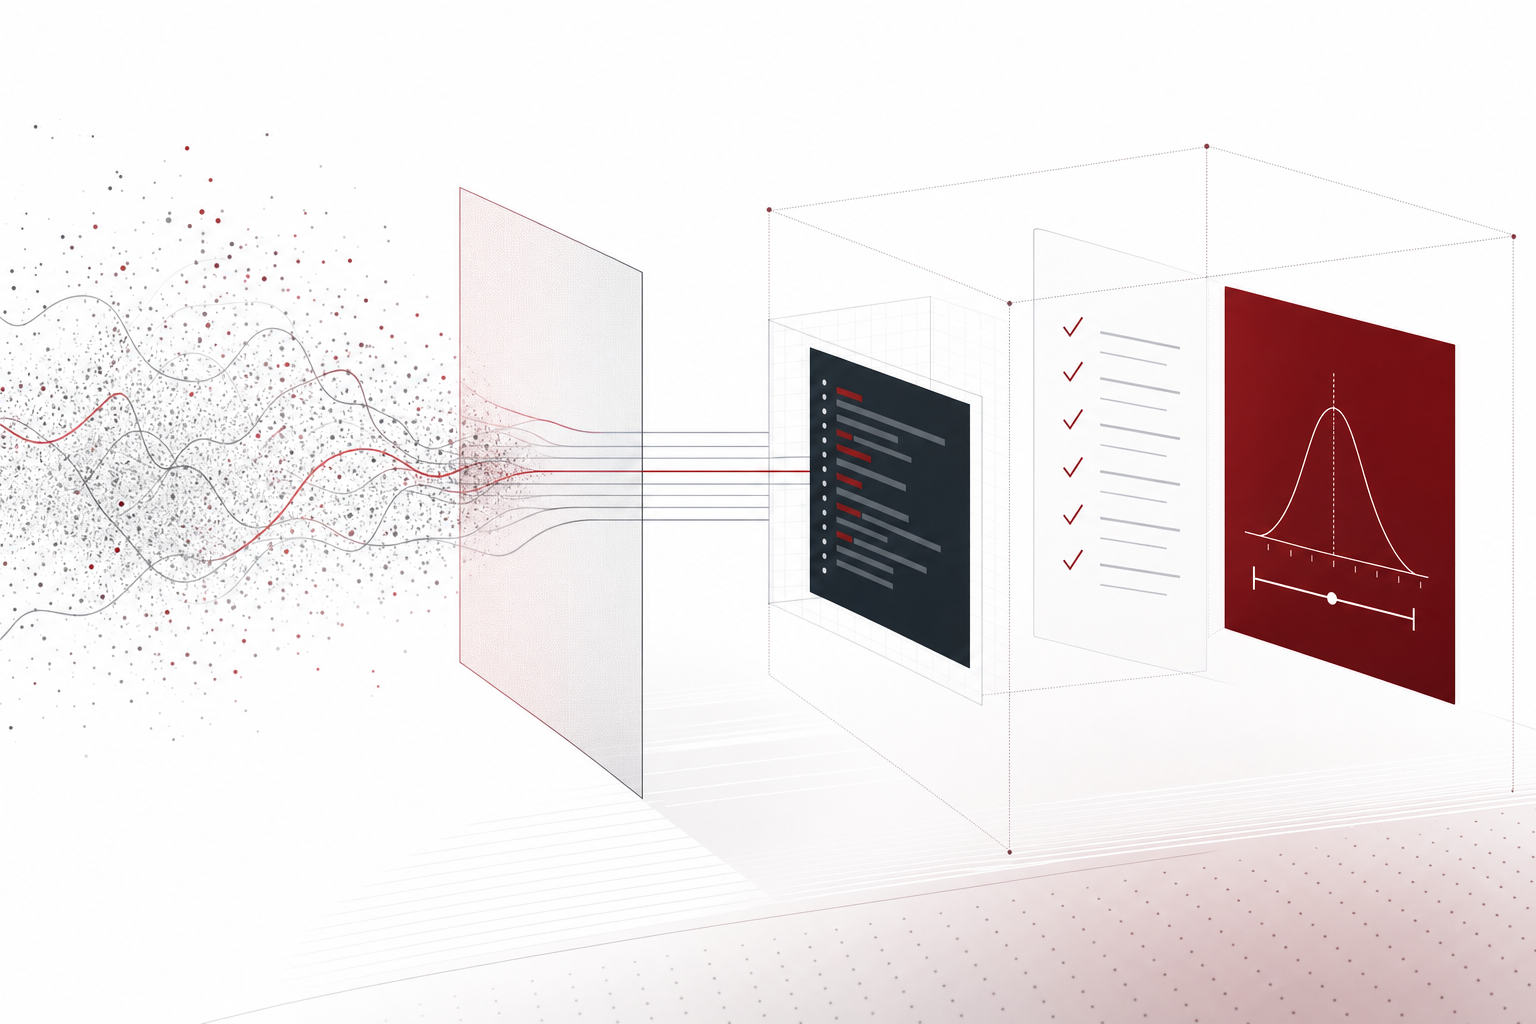 A visual metaphor for the article’s key idea.
A metric is a choice, not an observation
A system generates millions of events per second. The number that ends up in a report is a tiny slice of those events, summarized. That slice is never neutral. What you choose to summarize already decides half of the conclusion. Plenty of teams report the mean response time simply because the load-testing tool prints it by default, and call throughput “performance” simply because the dashboard already has a requests-per-second chart wired up. The moment a tool’s default output becomes an organization’s definition of performance, that organization stops knowing what it is actually optimizing for.
This problem surfaces most often in meeting rooms. When one person says latency went down and another says memory went up, and the two conversations run in parallel forever, it is because they are treating metrics that play different roles as if they carried equal weight. One is the thing this change is trying to improve; the other is a boundary that does not need to improve, but must not get worse. Put both in the same bucket and the argument never ends, because there was never a structure to end it.
The fix is structural: split every metric into one of three roles. The target metric is the single thing this piece of work is trying to improve, and it must be exactly one. The moment there are two targets, there is no longer a coherent way to judge a tradeoff between them. The guardrail metrics do not need to improve, but they must not cross a limit you set in advance. The diagnostic metrics exist purely to explain why the target moved, and are never themselves treated as optimization targets.
| Role | Count | How it is judged |
|---|---|---|
| Target metric | Exactly one | Degree of improvement |
| Guardrail metrics | Two to four | Whether a set limit was breached |
| Diagnostic metrics | Unlimited | Explanatory only, never optimized directly |
This table looks almost trivial on paper, but applying it noticeably shortens meetings. Set p95 latency under 300 concurrent users as the target, memory usage and error rate as guardrails, and queue depth and GPU utilization as diagnostics, and the next release review no longer opens with “latency went down but memory went up, so no.” It opens with a verdict: either the guardrail was breached and the change is rejected, or the target improved within the guardrails and it ships. Nobody has to relitigate the tradeoff from scratch every time.
Same command, different numbers: an unreproducible measurement is not a measurement
When the same command produces two different results, most teams do one of two things: pick the number they like better, or average the two and move on. Both are dangerous. If you do not first determine why the numbers diverged, the same instability will recur at the next measurement, and picking a favorite number quietly becomes standard practice.
The sources of that instability are not infinite. In practice they fall into four buckets: the system has not yet reached steady state, the baseline was captured at the wrong moment, there was only a single sample, or a resource that is not really yours is being counted as if it were. Walking through each one makes it clear why measurement is fundamentally a discipline problem, not a tooling problem.
There are many reasons the first run is slow: the runtime has not yet JIT-compiled the hot path, the page cache is cold, the connection pool is empty. GPU workloads add kernel auto-tuning and allocator warmup on top, and the clock itself only ramps up once load has actually arrived. A common misunderstanding is treating warmup as a courtesy that improves accuracy. It is not. Warmup defines which state you are actually measuring. To someone who wants cold-start latency, a warmed-up number is the wrong answer; to someone who wants steady-state latency, a cold number is the wrong answer. The measurement spec should state, before it ever mentions a warmup count, exactly which state is being captured.
Whether steady state has been reached should never be a judgment call made by eye; it should be decided by a number. A practical method is to slice the measurement window into several smaller windows and check whether the medians of the last three fall within a set percentage of each other, discarding anything collected before that condition holds. This removes the need to hand-pick a warmup count, and the procedure keeps working even as the environment changes underneath it. A single-sample measurement is a variant of the same trap: without the habit of running five repetitions and reporting the interquartile range, one lucky run quietly becomes the number in the report.
Finally, shared-resource contamination is especially common in cloud environments, where a different workload on the same node degrades your system’s apparent performance and gets misattributed to your own code. This is essentially impossible to reconstruct after the fact. Node occupancy and the presence of noisy neighbors have to be recorded at the moment of measurement, not guessed at afterward.
How benchmarks lie: a design problem, not an intent problem
When a benchmark ends up distorted, it is rarely because someone set out to deceive. The person who designed the measurement was usually conscientious, and the person who published the result usually believed their own number. The real issue is that measurement, as an activity, has an unusually large number of openings through which human expectation leaks in. And this distortion is not confined to any one tool or domain. Whether the system under test is a web service, a database, or a model inference server, the same patterns repeat wherever performance numbers get passed around.
The most common and most consequential distortion is synthetic load that fails to resemble the real-world distribution it stands in for. Synthetic load is attractive precisely because it is easy to generate and reproduce, but that convenience is itself a warning sign. The classic shape: send the same request over and over and the cache hit rate converges to one hundred percent, showing off performance the system does not actually have in production. Force every request to the same size and you erase the memory pressure and tail latency large requests create. Space every arrival perfectly evenly and you erase the bursts of real traffic, along with any window in which a queue would actually build up.
The fix is to draw the load generator’s input from real distributions pulled out of production logs: the mix of request types, the size distribution, the inter-arrival distribution, all estimated from actual data. A perfect reproduction is not necessary, only a plausible shape. The benchmark spec should carry one line stating exactly which logs, from which date, the workload was derived from. Without that line, the benchmark either gets dismissed as baseless six months later or, worse, gets uncritically re-cited forever.
Here is the part that matters most. Writing these rules down in a document is not enough. Rules that depend on humans remembering them collapse first under deadline pressure, and it is precisely the number produced under that pressure that shows up in a promotion packet or a release-approval meeting. So this discipline has to move from prose into code: fail the pipeline if the load generator falls back to a uniform distribution never in the spec, and block the benchmark run entirely if the one-line provenance field is empty. A rule only survives a busy day once it becomes a gate the pipeline enforces, not a norm a person is expected to remember.
A number without conditions is not data, it is a rumor
Even after you have chosen the right metric, controlled the environment, and gated the common distortions, you are not done. What remains is turning that number into something someone else can act on, and this is exactly where most teams lose everything they built up to this point. A carefully measured value gets copied onto a slide, the conditions fall off in the process, and the number gets re-cited weeks later in a completely different context.
The final stage of measurement is not statistics, it is prose. How you write the number down determines how long it stays true. The smallest reportable unit is not a single number but a bundle of three: the value, how much it varies, and under what conditions it was captured. Drop any one of the three and the sentence can no longer be reused.
Take the sentence “p95 response latency was 180 milliseconds.” That is only half a sentence. A complete one reads: “under 300 concurrent users with a median request size of 4 kilobytes, p95 response latency was 180 milliseconds, with an interquartile range of 174 to 191 milliseconds across five repetitions.” It looks longer, but it is still true six months from now, while the short version stops meaning anything within a week. A number with no conditions attached is not really data, it is a rumor whose meaning keeps shifting depending on who is citing it.
Efficiency metrics need one more piece: report both the absolute value and the marginal increase, labeled explicitly. Discussing service cost calls for the absolute value that includes idle consumption; discussing the marginal cost of one additional request calls for the incremental delta. Which one is correct depends entirely on the question being asked, so it is safer to report both than to guess which your audience needs.
Even a number with conditions attached drifts inaccurate over time if those conditions only exist as prose. Every measurement run should also produce a machine-readable ledger alongside the sentence, at minimum capturing the execution timestamp and operator, the code commit hash and config file hash, and the hardware and driver versions. With that ledger in place, “why is last month’s benchmark different from today’s” gets answered by a record instead of a memory.
Why this matters more now than it used to
This discipline used to be something only a performance team cared about. That is no longer true: GPU-hour cost is high, and an inference-serving fleet’s size can shrink or grow by multiples based on a single autoscaling threshold. The moment one unconditioned number becomes the basis for a capacity decision, whatever error is baked into it converts directly into a dollar figure.
Worse, these decisions rarely stay contained to a single meeting. A threshold set early on becomes a baseline other teams keep referencing indefinitely. Mistake a cold-state latency number for a steady-state figure and use it to set an autoscaling threshold too low, and the system keeps scaling up during moments it does not actually need to, quietly burning money. Go the other way, and an over-warmed, optimistic threshold leaves the system unprepared exactly when a real traffic spike hits. Both failure modes are quiet at first. The dashboard stays green until the problem shows up months later, during one specific window, and by then nobody remembers under what conditions that threshold was derived.
The problem gets sharper on workloads like model inference, where latency, throughput, and cost are tangled into a single decision. Raise the batch size and throughput goes up, but an individual request’s tail latency can blow past its guardrail. Shrink the batch size and the same hardware now serves fewer requests, driving up cost per request. A team that never split target from guardrail in advance ends up relitigating this exact tradeoff every time, and the outcome tends to depend more on who spoke loudest in the room than on the numbers themselves.
Turning the discipline into code: what you can do today
If you have read this far, one question remains: how do you turn this discipline into your team’s everyday procedure? The core move is converting rules that live in prose into gates that code enforces. A rule a human is supposed to remember eventually gets forgotten; a rule the pipeline refuses to let past cannot be, because nothing runs without it.
The first step is to pin down the target, guardrail, and diagnostic metrics on a single page before any measurement run begins, and to refuse to start a benchmark that does not have that page attached. The second step is to automate steady-state detection: instead of eyeballing whether warmup looks finished, have the pipeline compute how close the medians of the last several windows are to each other, and automatically discard everything collected before that condition holds. The third step is to build a pipeline that pulls the load generator’s input distribution out of production logs automatically. Leave that step to a human doing it by hand every time, and it quietly drifts back to a uniform distribution.
The last step is automating the report itself. Generate the value-variance-condition sentence automatically, and fail the report generation step outright if the condition field is empty. Pair that with the machine-readable ledger, and the next team that tries to reproduce this benchmark, or compare it against a past result, can rely on a record instead of on someone’s recollection.
All of this feels like overhead at first. Agreeing on a single target metric takes real discussion, and writing the steady-state detection logic takes real time. But that cost is paid once. The cost of a bad decision made on an unconditioned number gets paid over and over, usually much later and for a much larger bill than anyone expected. Next time you are about to put a benchmark result on a slide, ask whether you can complete the sentence describing exactly what conditions it was captured under. If you cannot, the number is not ready to be reported yet.
References
- Google SRE Book: Distributed Systems Monitoring and Telemetry (the four golden signals and the latency percentile discussion)
- JMH (Java Microbenchmark Harness), OpenJDK project page (a benchmark harness that separates warmup from measurement)
- JMH @Warmup annotation source (warmup iterations configured separately from measurement)