We Verified Work Automation Where Data Never Leaves the Building, on One Internal GPU
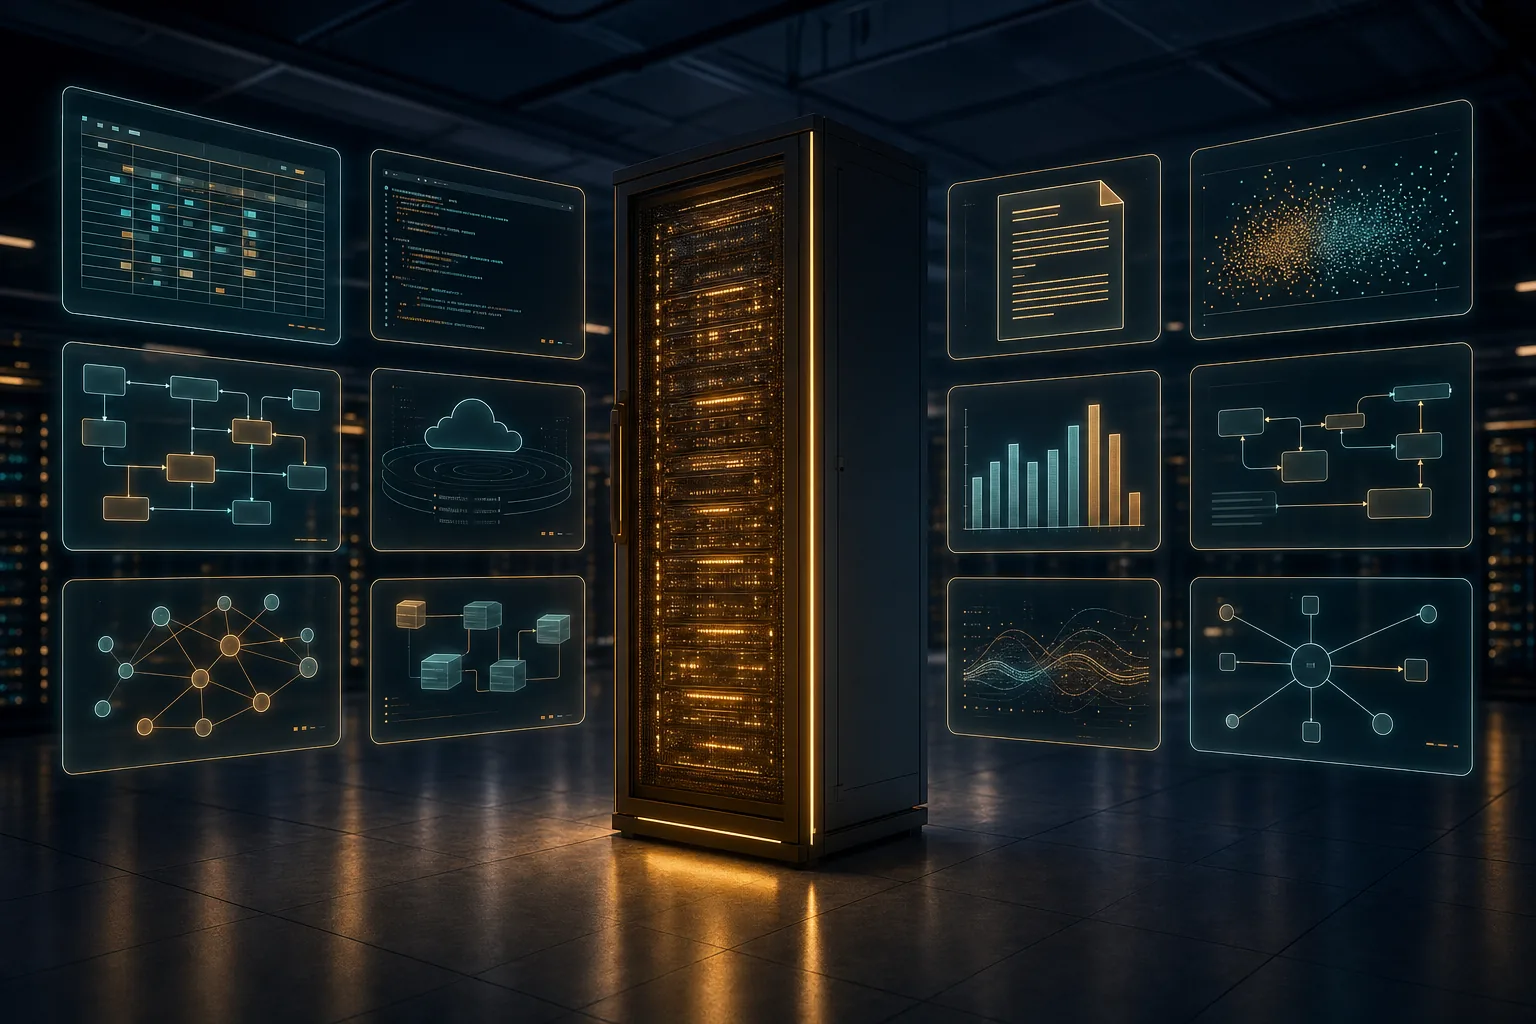
One rack, ten workloads. This is the exact setup we ran for this post.
For organizations that cannot send data outside, AI adoption usually stalls somewhere other than model performance. The performance is already good enough. The problem is that using it means sending contracts, incident logs, and customer complaints to someone else’s API. So the review keeps stopping at the same question: if you keep the model inside your own walls, does the work actually get done?
To answer that, we shrank a 27B model to NVFP4, deployed it on internal GPUs, and screen-recorded ten work agents covering everything from quarterly close to infrastructure incident diagnosis. All ten finished, with zero external API calls. Single-request latency actually came out faster than the bf16 original before quantization.
We think a setup only earns the word sovereign when three things are true at once. Data actually has to stay inside. Work has to finish end to end inside that boundary. And when a defect turns up, we have to be able to fix it. We confirmed the first two this time. The reason we decided to write this post is the third.
Five of the ten Korean-language responses had simplified-Chinese characters mixed in, while both commercial model arms had zero under the same conditions. That is the axis we lost on. But because the checkpoint is ours, this defect is not something to wait on. It is work for the training layer to pick up. If it were someone else’s API, finding the defect would leave us nothing to do but file a support ticket. The third condition only actually gets tested once a defect like this shows up.
We include the cost numbers too. Converting the same workload to commercial API list prices comes out to 123x against Claude Opus 5 and 135x against GPT-5.6 Sol. Instruction compliance tied Claude Sonnet 5 and Haiku 4.5.
By “finished” we do not mean the reply merely reads plausibly. It means the agent wrote Python itself and ran it inside an isolated Docker sandbox, searched the web nine times to gather evidence, queried the internal wiki, made twenty tool calls, and decided on its own when the task was done. Every video below runs at real time. We did not touch the playback speed, so the elapsed time you see is the elapsed time it actually took.
What We Ran
The ten cases were not built for this post. They are agents that already live on the platform, and the fact that none of them was tuned for a demo is the point. Each agent already had its own persona and tool permissions in place; all we swapped was the model underneath.
| Case | Agent | Turns | Steps | Input tokens | Output tokens | Time |
|---|---|---|---|---|---|---|
| Quarterly close calculation | Finance | 2 | 3 | 11,733 | 1,346 | 16.0 seconds |
| Pod failure diagnosis | Infra diagnostics | 3 | 6 | 22,293 | 13,841 | 108.2 seconds |
| Go handler security review | Codex coding | 10 | 20 | 104,869 | 11,339 | 99.4 seconds |
| Weekly status report | Weekly report automation | 2 | 3 | 11,428 | 1,571 | 16.5 seconds |
| On-prem proposal outline | Sales | 2 | 3 | 14,385 | 3,417 | 28.2 seconds |
| Toxic clause review | Legal | 1 | 1 | 7,908 | 3,370 | 26.0 seconds |
| RFP response matrix | PM | 5 | 20 | 51,780 | 3,332 | 38.5 seconds |
| SQL drafting with self-verification | Data | 2 | 3 | 13,279 | 9,094 | 70.4 seconds |
| Double-billing response | Customer support | 1 | 1 | 8,899 | 2,833 | 22.0 seconds |
| Competitive intelligence | Marketing | 4 | 13 | 43,539 | 2,697 | 26.6 seconds |
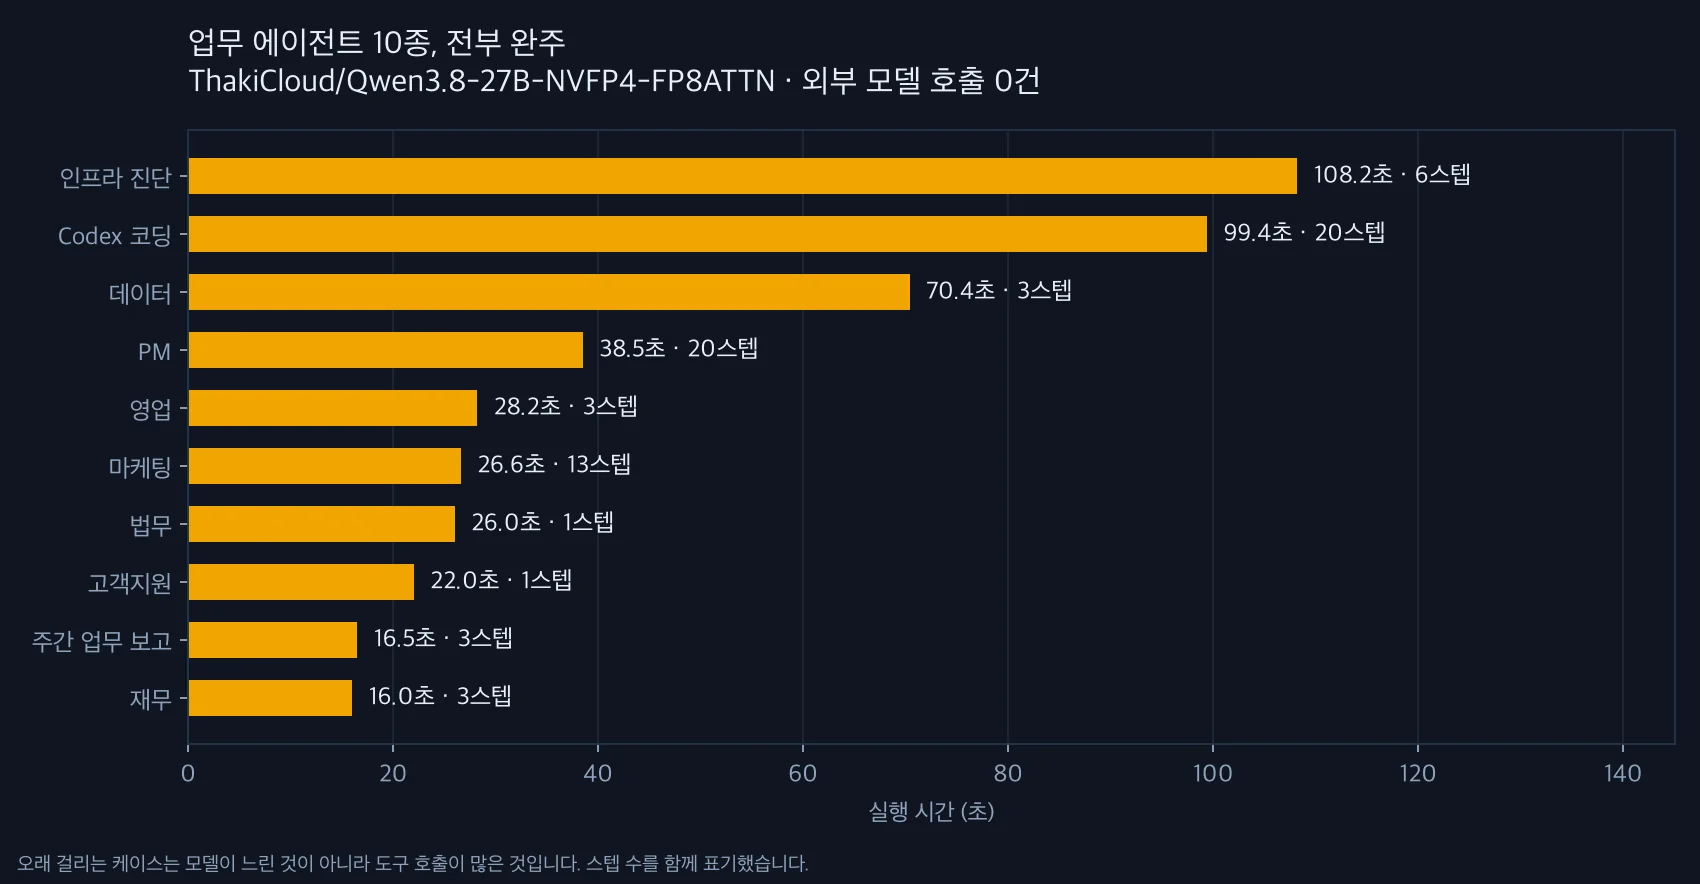
The cases that took longest were not slow because of the model. They called more tools.
Across all ten runs, the totals are 290,113 input tokens and 52,840 output tokens. The elapsed times come from the server’s execution trace; the videos run a few seconds longer because they include screen rendering and a pause to read the final sentence.
The Ten Cases
Finance: it computes, it does not make numbers up
We gave the agent quarterly revenue by division and asked for growth rates, on the condition that the calculation had to run as code. It wrote Python, ran it in the sandbox, and built the resulting table itself. It also flagged, on its own, that total revenue rose 6.70 percent while the infra division alone fell 4.80 percent.
This is where the usual problem of a language model producing a plausible wrong answer to arithmetic disappears. The model does not calculate; it uses a calculator.
The finance agent actually computes the quarterly growth rate with code_execute. The executing model and the tools used are shown at the bottom.
Data: it verifies its own SQL
We asked for SQL that computes monthly revenue and its month-over-month growth rate. The agent did not stop at the query. It generated sample data, ran the logic in Python, and checked the result against expected values with assert.
In the process it found edge cases on its own. A prior month of zero revenue sends the growth rate to infinity, so it guarded that with NULLIF. It also noticed that a version excluding months with no transactions and a version that fills every calendar month give different answers. It built and ran both versions, then asked us to decide which one to use. It found the gap in the requirements by actually executing the logic.
In the terminal on the right, the assert passes and the process exits 0. That is not a claim that the SQL is correct. It is evidence.
Infra diagnostics: when it cannot verify something, it says so
We handed it a scenario where a pod is stuck at Running 0/1 but the pod list shows nothing at all. The agent ranked three likely causes by probability and attached the command to check each one.
What matters is what came next. The agent actually tried running kubectl in the sandbox, confirmed it was unavailable, and then asked us to hand over a kubeconfig or register a connector so it could run the diagnosis directly. It did not pretend to be connected to a cluster that was not there. This was the slowest of the ten cases, but not because the model is sluggish. It took three turns, including an internal wiki lookup and a code execution.
KUBECTL_UNAVAILABLE prints in the terminal, and the agent reflects that fact in its answer.
Coding: it takes apart a SQL-injection handler over twenty steps
We handed it a Go handler that builds queries by string concatenation and asked for a review. At ten turns, twenty steps, and 104,869 input tokens, this was the heaviest of the ten tasks. The point of this case was to see whether a quantized model loses its footing while holding a long context through repeated tool calls. It did not drop the thread once.
A code review spanning ten turns. This case checks whether context holds up across a long chain of tool calls.
Marketing: it actually searches the web
We asked about trends in the enterprise agent market, with the condition that it had to actually invoke web search. The agent alternated between searching and reading pages across thirteen steps. This case is meant to separate reciting what is baked into training data from pulling live evidence off the web.
It repeatedly calls web_search and web_fetch to gather evidence.
PM: it separates what it can commit to from what needs confirmation
We gave it six mandatory RFP requirements and asked for a response matrix. Over twenty steps, it split the items it could answer from the items that still needed confirmation into separate tables. The single most dangerous mistake in proposal work is marking an unverified item as compliant, and the agent held that distinction throughout.
It organizes the response matrix for six requirements and the list of items needing confirmation into separate sections.
Legal: it flags toxic clauses with a risk rating
A full liability waiver, use of customer data for service-improvement purposes, a three-year auto-renewal with a 180-day pre-termination notice, and governing law tied to the supplier’s home jurisdiction. We gave it these four clauses and asked for a review. This is a pure judgment task, no tool calls, done in a single turn, which makes it the case where quantization’s effect on reasoning quality shows up most directly.
A judgment task completed in a single turn with no tools.
Customer support: it appends a fact-check list
We asked for a Korean and English draft response to an angry customer complaint: charged twice, no reply for three days. The agent wrote both drafts, then attached a pre-send checklist: since the draft states the refund is complete, only send it once the refund has actually been processed, and a three-day silence is itself an SLA-violation signal that needs internal escalation. We did not ask for this, but we should have.
Pre-send checks appear beneath the Korean and English drafts.
Sales: it turns a data-export restriction into the axis of the pitch
A large manufacturer is evaluating internal document search and workflow automation. Data export is banned, and a competitor has already pitched a public-cloud SaaS product. We asked it to draft the outline for a first meeting.
It reframes the constraint as the core of the pitch instead of a weakness.
Weekly report: the lightest lift
Hand it a list of what you did this week and it turns it into a report for your manager. This was the fastest of the ten cases to finish. One daily chore, down to 16.5 seconds.
The lightest case of the ten.
Where the Speedup Shows Up, and Where It Does Not
Measuring raw decode speed alone, the NVFP4-quantized checkpoint runs 124 to 131 tokens per second against 88 to 91 for the bf16 original. That is about 1.40x, measured at concurrency 1, three repeats, 256 output tokens.
But that 1.40x does not carry through to a full agent turn as is. We ran three of the shorter cases five times each on both models and measured the median.
| Case | Our NVFP4 | bf16 original | Ratio |
|---|---|---|---|
| Finance (1 tool call) | 10.6 seconds | 12.6 seconds | 1.19x |
| Weekly report (3 tool calls) | 9.9 seconds | 12.2 seconds | 1.23x |
| Customer support (no tools) | 11.3 seconds | 25.5 seconds | 2.26x |
The reason the ratio settles down around 1.2x for tool-using cases is simple. Turn time includes spinning up the sandbox, executing code, and round-tripping to the web, and both models pay that cost identically regardless of speed. No matter how fast you make the model, the time it takes for a Docker container to come up does not shrink. So for agent workloads, quantization’s payoff is not the raw decode speedup; it is scaled down by whatever share of total time decoding actually occupies.
Conversely, the tool-free customer support case widened to 2.26x. But that number is not fully explained by decode speed alone, since it exceeds the 1.40x figure. The two checkpoints generate different token counts for the same prompt, so this ratio mixes a genuine speed difference with a difference in output length. It is not a fair number to cite as a speed improvement, so we leave it as an observation only.
What the Same Work Would Cost on Commercial APIs
The ten runs actually moved 290,113 input tokens and 52,840 output tokens. Converting that workload to commercial API list prices gives the numbers below. Our own cost is computed as rented time on one B200. At a measured saturation throughput of 3,586 tokens per second, the job took 14.7 GPU-seconds; at $5.50 per hour, that comes to $0.0225.
| Backend | Cost for this workload | vs. ours |
|---|---|---|
| GPT-5.6 Sol | $3.0358 | 134.9x |
| Claude Opus 5 | $2.7716 | 123.1x |
| Claude Sonnet 5 | $1.1086 | 49.3x |
| Kimi K3 | $1.6629 | 73.9x |
| GPT-5.6 Terra | $1.2143 | 53.9x |
| Claude Haiku 4.5 | $0.5543 | 24.6x |
| Our NVFP4 27B (self-hosted) | $0.0225 | 1x |
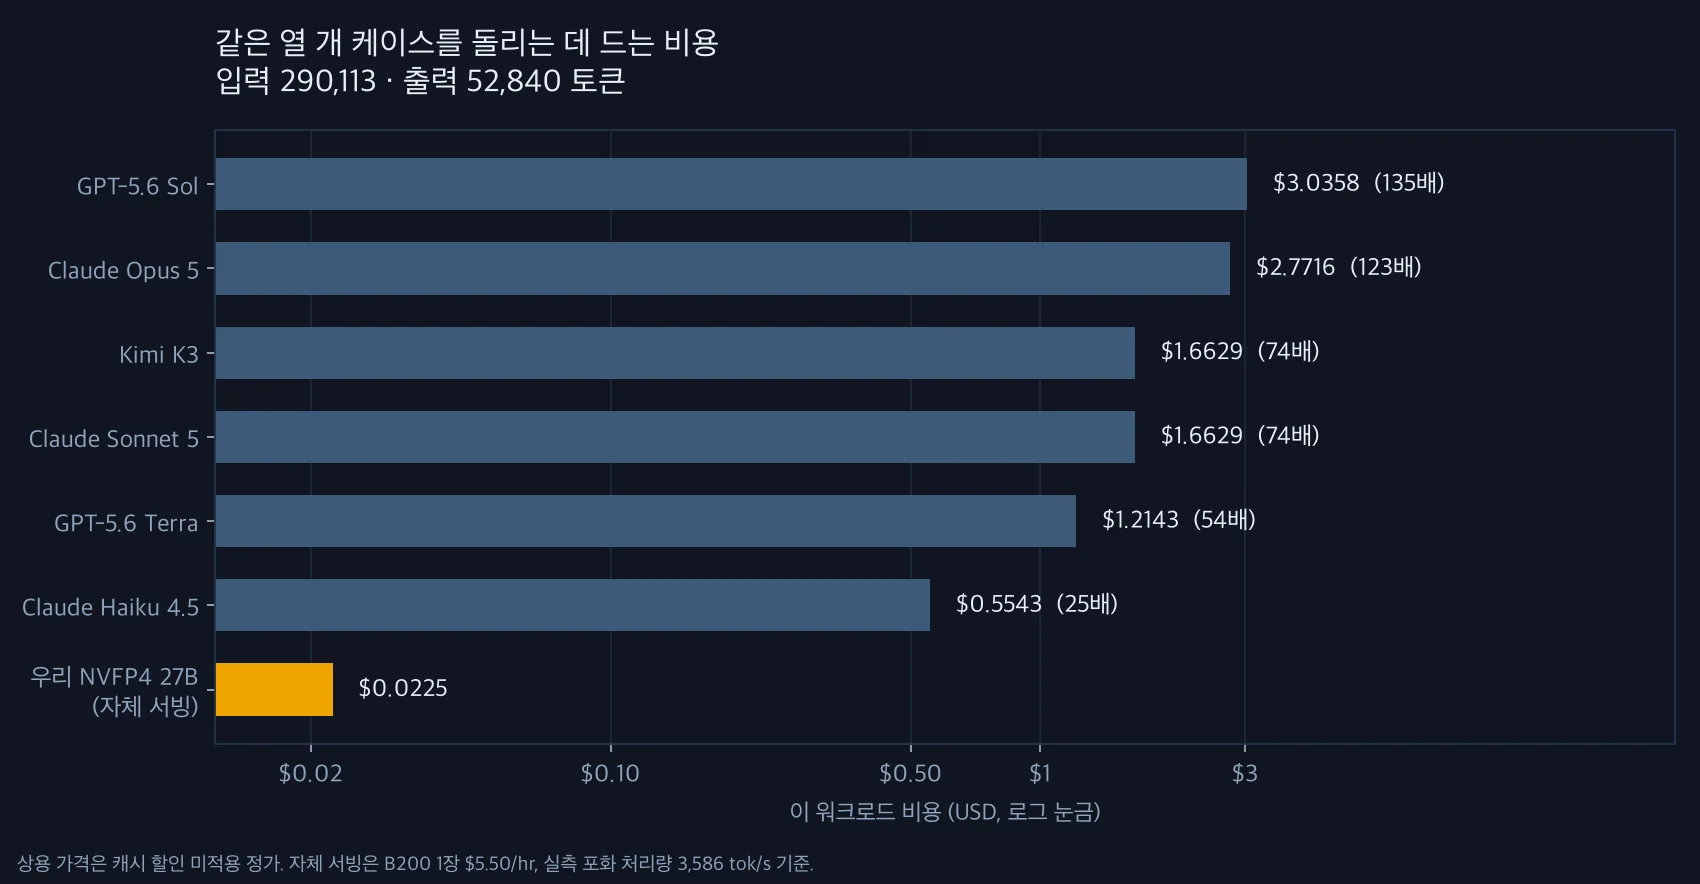
This is a log scale. Read the numbers, not the bar lengths.
The multiples look large, but the conditions matter. The commercial prices are list prices with no cache discount applied. In real large-scale operation, cache reads bill at roughly 0.1x the input rate and that line item dominates the bill, so the gap narrows sharply for workloads with a high cache hit rate. Conversely, our own number leaves out the cost of building the quantized checkpoint and the time the card sits idle. If you only run ten cases a day, renting a single GPU is far more expensive. This comparison only means something once you have enough volume to keep the card busy. Commercial list prices change often, so the table reflects the reference date of writing (2026-08-22). Check each provider’s current pricing page before you budget against it.
One more framing. Cost is less a reason to go sovereign than a line item that erases the counterargument. An organization that cannot send data out has a narrow set of options anyway, and the real question is what honoring that constraint costs. This table says that for an organization with the volume, it costs nothing.
We left Fable 5 out of the table because we do not have a public price list for it. A blank is better than a guessed number.
Instruction Compliance and Korean Quality
Cheap means nothing on its own. What matters first is whether it does what it was told, and whether the Korean output is clean. We ran the same ten cases through the same agents on three backends and counted three things.
Completion rate alone shows no difference: all three backends finished all ten cases. So we looked at a stricter axis. Four of the ten prompts spell out an externally verifiable obligation. The finance and data cases required the calculation to run as executed code, the marketing case required an actual web-search call, and the customer support case required both a Korean and an English draft. Compliance is judged from the tool-call log and the literal text of the response.
| Completed | Compliance | Korean purity | Hanja leaks | Total time (10 cases) | |
|---|---|---|---|---|---|
| Our NVFP4 27B | 10/10 | 4/4 | 99.33% | 11 characters | 325.7 seconds |
| Claude Sonnet 5 | 10/10 | 4/4 | 100.0% | 0 characters | 351.2 seconds |
| Claude Haiku 4.5 | 10/10 | 4/4 | 100.0% | 0 characters | 373.8 seconds |
Compliance ties across all three backends. Our total time was the shortest, but per-case variance is wide enough that this gap should not be read as a ranking. Each case was measured once, so it sits inside the noise band.
The real difference showed up in Korean purity, and we lost that one.
Where Our Model Lost
Five of the ten responses had simplified-Chinese characters mixed into the Korean text. Eleven characters in total.
The finance case wrote “최대 증분(절대값)을贡献” (contributes the largest increment in absolute value), where 贡献 means “contributes” or “contribution” in Chinese and simply has no business appearing in a Korean sentence. The coding case wrote “클라이언트가断开되어도” (even if the client disconnects), where 断开 means “disconnect.” The weekly report wrote “本周의 장애 2건” (2 incidents this week), where 本周 means “this week.” The data case wrote “8월로正确地 이어짐” (correctly carries over into August), where 正确地 means “correctly.” The legal case’s “초期货보다 긴 점” (longer than the initial term) is especially bad: 期货 is the Chinese word for “futures,” as in futures trading, so beyond breaking the script, it is also the wrong meaning for the context.
The conclusions and figures in every response were correct, and all ten cases finished, so this is not a fatal defect. But it means the output is not usable as-is for a document that goes to a customer in Korean. Both Claude arms had zero occurrences under the same conditions. The cause appears to be the base model’s tendency toward multilingual cross-contamination rather than quantization itself; the same pattern shows up in the bf16 original before quantization too.
For that reason, we run a deterministic purity gate over Korean output in the pipeline. Counting Hangul, Hanja, and Kana characters is arithmetic, not a model judgment call, so code should catch this defect before a human ever reads it. The actual fix belongs to the training layer, not the serving layer, and that is why Maxis comes up in the next section.
What These Numbers Say, and What They Do Not
A throughput number without disclosed measurement conditions means nothing, so we spell out the scope here.
Both endpoints have max_model_len set to 262,144, and both run with compilation on. An endpoint with compilation off drops to as low as 7.4 tokens per second under the same conditions, and both of our arms ran above 88, so that axis is settled. We could not confirm max_num_seqs, though, since the pod spec is not readable from outside the internal network. That value caps how many sequences can be processed concurrently, and at concurrency 1 there is nothing for it to cap, so it does not affect single-request latency.
So the numbers above are client-observed wall-clock time at concurrency 1. They are not throughput and not capacity. Behavior under concurrent load needs a separate measurement and is out of scope for this post.
How Do We Know the Data Actually Never Left
This is the one place a sovereign-setup claim actually needs verifying. Everything else is visible. This is the only part that is not. You cannot tell which backend answered just by looking at the screen.
So we make that call from server logs, not from what is on screen. The line the server writes when a request actually goes out carries the transmitted model identifier, and that is the only evidence we accept. A line where the router logs which model it decided to use is a decision record, not a transmission record, and we have seen cases where it did not match what was actually sent. So we do not use that line for judgment.
This verification is not a formality. In this very recording round, three cases were quietly served by Claude Sonnet 5, and without the log check they would have shipped as videos of our own model. The gate discarded the frames before they were written to mp4, so that footage does not exist, but the execution trace survived, and it turned out to be more useful anyway.
| Case | Claude Sonnet 5 | Our NVFP4 27B |
|---|---|---|
| PM requirement matrix | 67.2 sec · 6 turns · 18 steps | 38.5 sec · 5 turns · 20 steps |
| Marketing web search | 40.9 sec · 3 turns · 8 steps | 26.6 sec · 4 turns · 13 steps |
| Infra diagnostics | 45.8 sec · 1 turn · 1 step | 108.2 sec · 3 turns · 6 steps |
In the first two cases, our model took more steps and still finished faster. The third looks reversed, but it reads differently. Sonnet answered and stopped in a single step; our model took six. Inside those six steps was the process of actually running kubectl in the sandbox and confirming it was unavailable. Whether incident diagnosis calls for a fast answer or a verified one depends on the situation, but it is clear these two numbers should not be placed on the same axis and compared.
For the final ten-case recording, the transmitted model was a single one, ThakiCloud/Qwen3.8-27B-NVFP4-FP8ATTN, with zero external calls. That is also why the executing model is shown at the bottom of every video. You should be able to ask after the fact which backend actually answered.
This distinction matters because an agent does not call the model just once. The ten cases in the table earlier in this post add up to 32 turns and 73 steps, and every step carries its own model call. On top of that, auxiliary calls, routing decisions, title generation, and the like get bolted on separately. If even one of those goes outside, the contract text or incident log riding on that turn has already left. You cannot run only the main call on an internal model and call the whole thing sovereign. In fact, the longest-running bug we chased in this project was exactly that kind. The main turn went to the internal model while a classifier and a title generator were quietly going outside, and nobody knew until we started counting the logs.
Which Layers Have to Be Ours for This to Count as Sovereign
Putting a model on your own servers does not by itself make a setup sovereign. Data never left the building in this run because all three layers sat inside the same wall. If even one of those layers had belonged to someone else, some call from the previous section would have leaked out.
The layer that actually automates the work is Paxis. It defines agents, grants tool permissions, and runs the execution loop. The ten agents in the videos, the sandbox execution, and the twenty-call tool chains are all output from this layer. From a sovereignty standpoint, what matters more is the audit trail that sits alongside it. If you cannot later ask which tool was called, when, and with what, you cannot prove the data never left either.
The layer that serves the model those agents call, on internal GPUs, is Metis. This comparison was possible because we could deploy the NVFP4-quantized checkpoint and the bf16 original the same way and swap between them at request time. If switching models required a code change, a measurement like this would take a whole day.
And the work that shrank that 27B model to NVFP4 and fit it into 21 gigabytes is quantization work in the Maxis family. The fact that the checkpoint is ours matters more when you hit a defect than it does for performance. The simplified-Chinese leak we saw earlier is exactly that case. No amount of tweaking the serving configuration makes that defect go away; it has to be fixed in the training data and the alignment stage, and whether we can actually reach that stage is exactly the third condition.
To sum up: Paxis automates the work, and Metis and Maxis are what make it possible to run inside our own walls. When all three layers sit inside the same organization, swapping a model and measuring the effect stops being an experiment and becomes operations. And when a defect turns up, we are standing in the position to actually fix it.
What Is Still Open
We have not yet measured behavior under concurrent load. Good single-request latency is no guarantee of good throughput, and that axis depends heavily on serving configuration, including max_num_seqs. Do not use the numbers in this post as-is for capacity planning.
The same caution applies to quality. All ten cases finishing means we did not fail on these ten cases. It does not mean quantization has no effect on quality. The simplified-Chinese leak is a confirmed defect and it is being addressed at the training layer. Behavior under adversarial conditions is being measured separately.
For an organization that cannot send data outside, we don’t think the question that actually matters is what percentage of a commercial model a quantized model reaches. It is how many of your ten workloads finish inside your own walls, what stops the ones that don’t, and whether the cause sits in a layer you can actually reach. This post answered the first two questions with ten cases. It answered the third with eleven simplified-Chinese characters.
If you are evaluating self-hosted GPUs for running work agents, we would recommend picking whichever of these ten cases is closest to your own work and measuring it the same way. That is a far more honest signal than a benchmark score.
Every number in this post was measured on internal GPUs on August 22, 2026, and cross-checked against execution traces and server logs.
Sources
- ThakiCloud/Qwen3.8-27B-NVFP4-FP8ATTN model card (Hugging Face)
- Claude Opus 5 launch and API pricing (Anthropic)
- Claude Sonnet 5 API pricing (Anthropic)
- OpenAI API pricing (gpt-5.6 sol/terra short and long context)
- NVFP4: NVIDIA Blackwell 4-bit floating point format (TensorRT docs)
- vLLM 0.24.0 release (GitHub)