What Made an Agent Turn 2.59x Faster Was the Drafter, Not the Cache

When the prompt is long and the answer is short, prefill eats the wall clock. When the model reasons at length, decode does.
If you run agents that swallow whole internal documents, this post is a measurement of which knob actually pays off. The short answer: it was the drafter, not the prefix cache, and it cut the same four jobs from 173.8 seconds to 67.2 seconds. Converted to GPU hours, that comes back to 7.4 hours per 1,000 agent turns.
An earlier measurement on the same endpoint said the opposite. There, prefix cache was everything. Both measurements are correct. When the shape of the workload changes, so does which lever works.
What was measured
We didn’t build new examples for this. We fed the model documents that actually live in this repository: the full engineering whitepaper to an engineering agent, backend startup logs to an infrastructure diagnostics agent, four Go handler and router files to a Codex coding agent, and the entire set of experiment findings to a data agent. The input actually sent was, in order, 93,309, 40,016, 40,447, and 29,978 tokens. Those numbers include the system prompt and tool schemas, not just the document, so they run a bit larger than the raw document itself.
The agents weren’t newly built for this either. We used ones already registered on the platform and just swapped in a different model.
All three arms use the same 27B NVFP4 checkpoint. The only thing that changes is the serving configuration. The current arm runs vLLM 0.24.0 stable with neither prefix cache nor a drafter. The middle arm runs the nightly engine with prefix cache turned on. The right-hand arm adds a DFlash2 drafter with K=7 on top of that.
The middle arm is the control. Without it, there’s no way to separate what the cache earned from what the drafter earned. In practice, it turned out to be the arm that told us the most.
Results
Median of three runs per case.
| Case | Current | Cache only | Cache + drafter |
|---|---|---|---|
| Whitepaper audit | 62.4s | 71.8s | 18.8s |
| Log diagnosis | 34.0s | 30.6s | 20.7s |
| Code trace | 47.2s | 57.4s | 14.7s |
| Ledger audit | 30.2s | 31.0s | 13.0s |
| Total | 173.8s | 190.8s | 67.2s |
The cache-only arm comes in at 0.91x. That means it didn’t get faster, and since the three repeat runs overlap with the current arm’s range, there’s no basis to say it got slower either. Nothing happened.
The drafter arm comes in at 2.59x. In three of the four cases, the repeat-run ranges don’t overlap with either of the other two arms at all. In the remaining case, it grazes the cache arm by about a second. This isn’t a comparison of medians; the observed ranges themselves are separated.
The totals are safe to quote because the answer volume the three arms produced is within 2.4 percent of each other. Looked at case by case, there are cells where answer length diverges by more than 20 percent across arms, and the aggregation code blocks quoting a multiple for those.
Answer length was not generation volume
I got this wrong once. At first I normalized time by answer character count, and that normalization wasn’t normalizing anything.
This model reasons at length before it answers. The actual numbers left in the trace show a turn with an 866-character visible answer and 5,060 output tokens. Most of what’s generated is reasoning that never appears on screen. We fed the same prompt to all three arms and capped output at 1,024 tokens. All three spent the entire 1,024 tokens on reasoning and ended with a zero-character visible answer.
So we split the data again, using actual token counts instead of answer character count. Paxis logs input tokens, output tokens, and latency for every model call. Within the same case on the same arm, input is nearly fixed, so regressing latency against output tokens gives a slope that’s the inverse of decode speed, and an intercept that’s prefill plus harness overhead.
| Arm | Decode | Intercept |
|---|---|---|
| Current | 122.3 tok/s | 1.7s to 4.1s |
| Cache only | 122.2 tok/s | 0.9s to 3.6s |
| Cache + drafter | 309.6 tok/s | 0.8s to 3.3s |
All twelve cells have an R-squared between 0.91 and 1.000, so the fit is nearly linear. The intercept range comes from input length differing by case; the 83k case is the upper value.
Where the time goes decides the lever
One chart explains everything above.
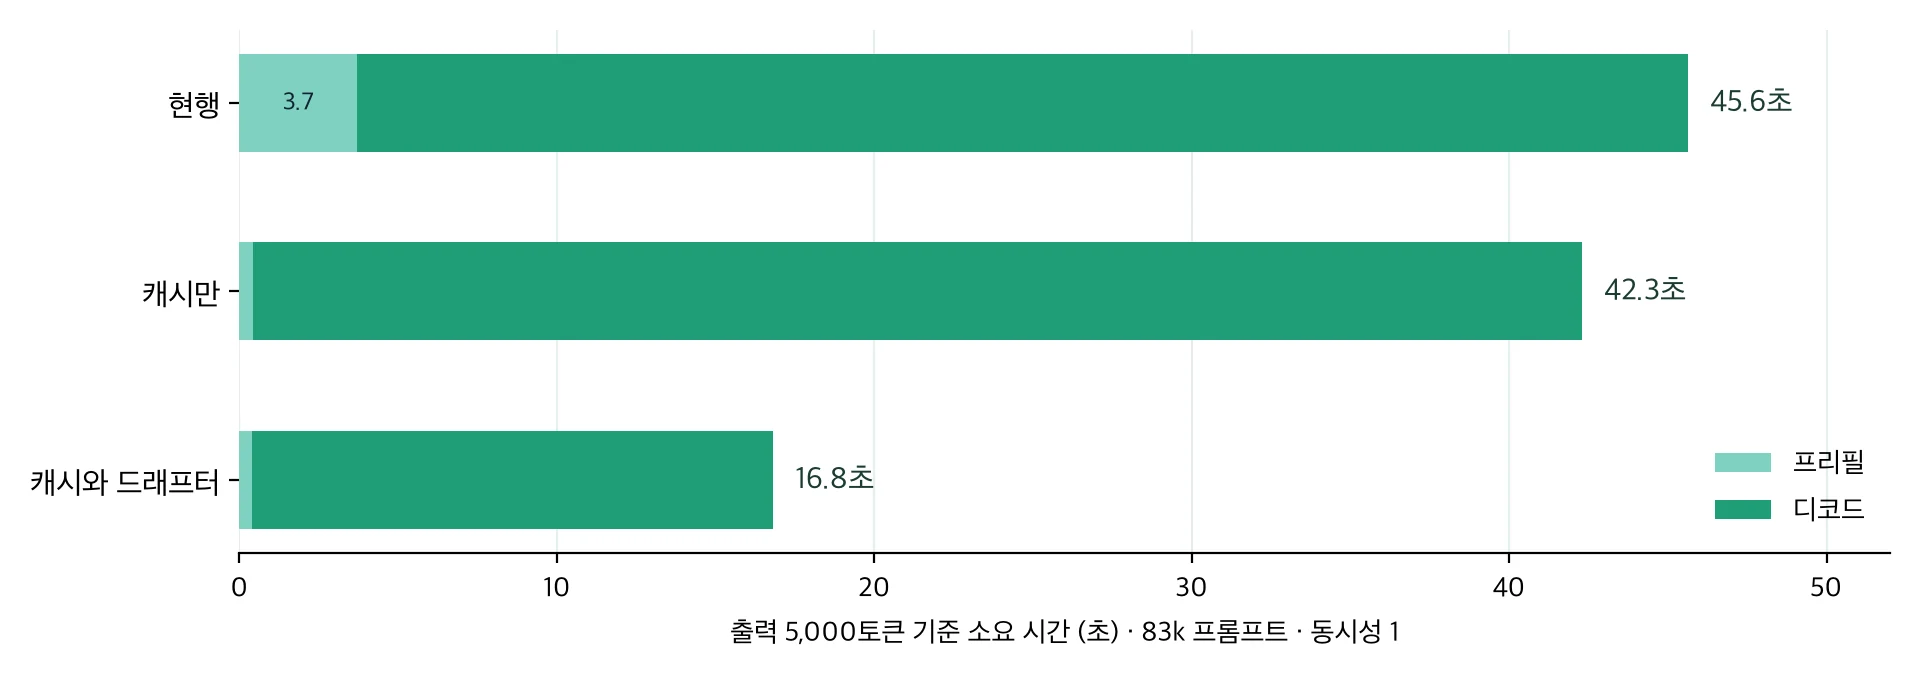
This assumes an 83k prompt producing 5,000 output tokens. Of the five figures here, 5,000 is the only chosen one; prefill and decode are both measured.
Cache takes decode from 122.3 to 122.2. It does exactly nothing there, and that’s what it’s supposed to do. Cache shrinks prefill; it doesn’t touch decode.
That doesn’t mean the cache is broken, though. To check, we fed the same 83k prompt to all three arms and fixed output at 128 and 1,024 tokens to get two points and isolate prefill alone. Cache cuts prefill from 3.69 seconds to 0.42 seconds. That’s 8.8x. It works fine.
The problem is where that 3.3 seconds lands. In this workload, decode takes 20 to 50 seconds per case. A well-functioning 8.8x gets buried in that.
The same measurement put decode at 119.2, 119.4, and 304.8 tok/s. This token-fixed measurement and the regression above are independent of each other, and they agree within 5 percent.
The drafter works on the other side. It takes decode to 2.53x, and since this workload is decode-dominated, that multiple shows up almost unchanged in the wall clock.
An earlier measurement on the same endpoint said the opposite. In that corner case, a 234k prompt asking for a 64-token answer, prefill was 95.9 percent of the wall clock, and prefix cache cut prefill from 14.70 seconds to 0.72 seconds, earning 20.4x. In that setting, the drafter’s contribution was only a 1.85x on decode, barely visible.
The two measurements don’t contradict each other. When the prompt is long and the answer is short, prefill dominates and cache is the answer. When the prompt is shorter than that and the model reasons at length, decode dominates and the drafter is the answer. Once you use a reasoning model, most real work shifts toward the latter.
Which knob to turn is decided not by a benchmark but by your own traffic’s prefill-to-decode ratio. You measure that ratio with the regression above. Borrow someone else’s multiple and, like us, you can land on the wrong side.
Cost
What self-hosting buys is GPU hours, not tokens, so the speed gain turns directly into the bill. At $5.50 per hour for one B200, a completed agent turn goes from $0.0664 to $0.0257. Scaled to 1,000 turns, 12.07 GPU hours becomes 4.67 hours, and in dollars, $66.38 becomes $25.67.
That’s 7.4 GPU hours back per 1,000 turns. If a team runs this scale of document analysis every day, that many cards can go serve other jobs. The comparison against commercial APIs is in part one, so we won’t repeat it here. It’s a different kind of cost, and the only unit that lines up in the first place is a single request.
One thing worth adding: prompt discipline is a lever of comparable size. On the same four cases, telling the model to answer in a single sentence took the current arm from 173.8 seconds to 82.6 seconds. The engine didn’t get faster; the number of generated tokens shrank. In this case, though, the three arms’ output volume diverged by up to 18.4 percent, so we’re not quoting it as a multiple.
Screen recordings
We recorded each of the four cases on both arms and placed them side by side. The current arm is on the left, the drafter arm on the right, and both start at the same instant. When the right side finishes first, its last frame holds while the left keeps going. Playback speed is untouched.
The model picker at the bottom of each pane shows which backend is selected, and for all eight clips we confirmed from the backend log that the model in question is the one that actually answered.
Whitepaper audit, engineering agent
Model call time was 47.7s on the current arm and 26.9s with the drafter. Generated tokens were 4,908 and 5,470.
Log triage, infrastructure diagnostics agent
Model call time was 39.1s on the current arm and 21.0s with the drafter. Generated tokens were 2,131 and 5,376.
Code trace, Codex coding agent
Model call time was 83.3s on the current arm and 15.7s with the drafter. Generated tokens were 7,603 and 3,880.
Ledger audit, data agent
Model call time was 111.6s on the current arm and 18.4s with the drafter. Generated tokens were 5,436 and 6,454.
These eight clips are one run each, so they are not the same figure as the 2.59x above. The gap you see on screen is wider, and there is a reason for that which is worth stating. The recordings were made six hours after the measurement, in the evening, and at that hour the current arm produced 37.0 tok/s on the same fixed-token probe. In the afternoon it produced 119.2. All three arms had zero concurrent requests, so this was not my own traffic queuing, and why that endpoint slowed down in the evening is not something we can pin down from here. The multiple quoted in this post is therefore the harness figure from three runs per case in the afternoon, and the videos are here to show what the same work looks like on screen under the two configurations.
What’s left
These are measured at concurrency 1. It’s the cost of a single dedicated stream, not the cost of saturated throughput.
The drafter arm’s max context is 245,760, not 1M. And the current arm runs vLLM 0.24.0 stable while the other two run nightly, so the only comparison with the engine version fully controlled for is between the middle and right arms. That’s also the pair used when we talk about the drafter’s contribution.
Every number in this post comes from a ledger committed to the repository, and every calculation is owned by code.