Every defect code review found was a wrong one. What zeroed the yield was an absent one.
If you plan to train on what your agents actually did, it is worth seeing how such a pipeline returns zero without saying so. Our exporter turned 486 runs into 468 episodes, every one of them schema-valid, and not one run that called a tool produced anything trainable.
 “Wrong” defects show up as red dots on the surface. “Absent” defects are the missing cube, invisible no matter how long you read the code.
Nothing failed
No error log. Exit code 0. The report said “468 written, 0 failed.”
The catch was that all 254 tool-using episodes came out carrying a truncated flag, and
that flag makes the validator refuse the episode. The rule behind it is right: training on
half an observation is worse than skipping the run. Here every observation was half.
Agent orchestration is tool execution by definition. A parent delegating to a child IS a
tool call, one named agent. So the yield for orchestration trajectories was exactly zero.
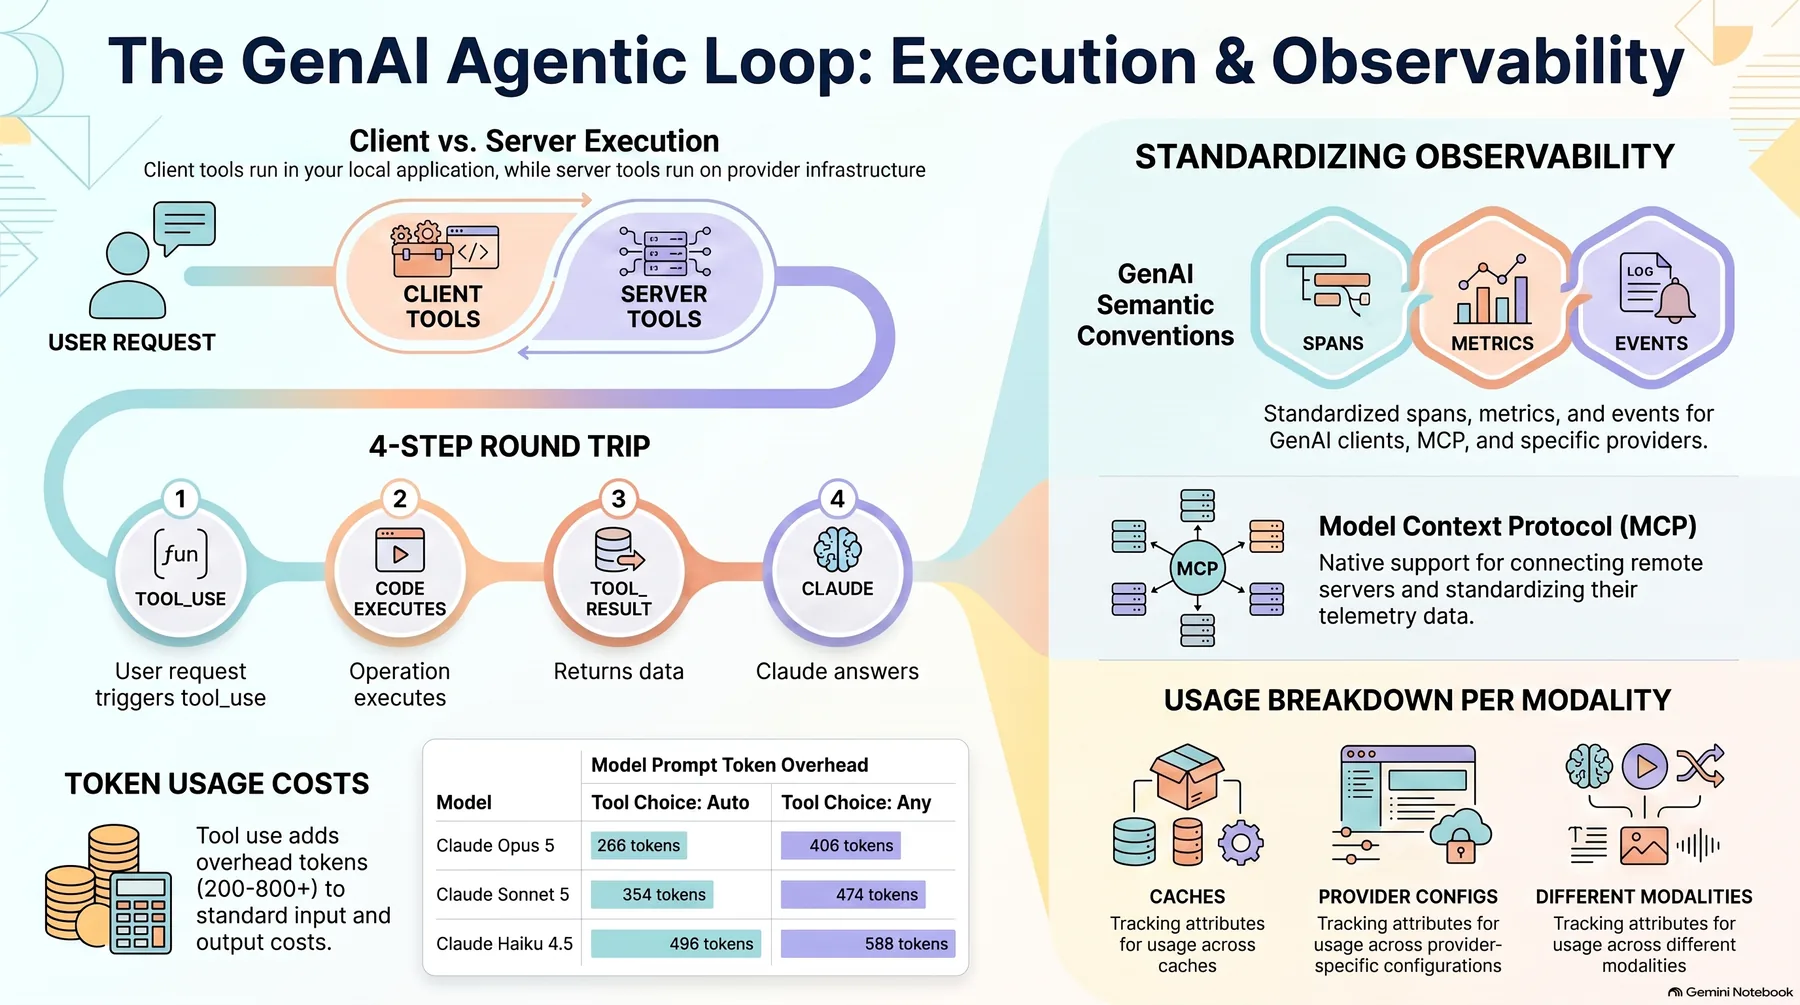 Infographic generated by NotebookLM from the sources.
Four defects that reading the code found
We read the code first, and four things came out.
The trace had no termination-reason field at all. The loop was producing typed values
such as success, max_turns and timeout, and the function that finalises the trace was
holding one in its hand, but the stored struct had nowhere to put it. Of 631 traces, zero
contained that string.
The classifier searched for a different string than the one emitted. The loop emits
max_turns with an underscore; the classifier looked for max turns with a space. A run
stopped by the turn cap exported as “no failure”: a clean success. The exact pathology we
wanted as a negative example, arriving with a positive label.
The outcome-label table was never joined. It held 402 rows and the assembler never read them.
The interface for fetching whole observations was declared, tested, and never injected in production. A full search of its callers returned four lines, all in a test file.
All four are real defects. Fixing all four and rerunning still produced zero.
Three defects that reading the code could not find
The same fact was written to two places and read from one
Tool-call records had two storage homes. The chat path writes them inside message metadata; the channel and connector path writes them to a dedicated column. The reader looked only at the column.
It took counting rows in both schemas to see it.
| Storage home | Written by | Actual rows |
|---|---|---|
unified_messages.tool_calls column |
channel path | 0 |
metadata->'tool_calls' |
chat path | 22 |
All traffic on this deployment is chat. So the assembler ran on the belief that no agent on this platform had ever used a tool, and that belief does not look wrong from outside. Runs without tool calls are perfectly ordinary. From the output alone you cannot tell a bug from a quiet day.
A display cap was deciding what the platform remembers
The chat surface truncates tool output at 1,000 characters. The tool-result store keeps a separate copy only for results above 16 KiB. The band between them was the problem: a result longer than 1,000 characters but under 16 KiB kept a truncation marker and no body anywhere.
Sorting the real stored results by size, 12 of the top 15 sat in that band.
Display truncation is a display concern, and it was deciding what the platform could remember.
Parallel calls collided on their identifiers
Tool-call ids were built as loop_<turn>_<tool>. Call the same tool twice in one turn and
both records get the same id. When a result arrives, the handler scans backwards and attaches
to the first match, so one record ends up holding another call’s output while its twin stays
empty.
A reviewer raised this in the abstract and I filed it as a corner case. Then I ran an orchestrator for real and opened the message row.
loop_1_agent   no body
loop_1_agent   no body
loop_1_agent   850 bytes
loop_2_agent   no body
loop_2_agent   751 bytes
Delegate three investigations at once and all three are named agent. For an orchestrator
that is not a corner case, it is the normal path.
The unique id was already in the model’s response. It was in scope at both dispatch sites. The callback simply never passed it along.
Results
| Metric | Before | After |
|---|---|---|
| Episodes written | 468 | 468 |
| Episodes with a tool result | 254 | 256 |
| Of those, passing validation | 0 | 5 |
| Tool results carrying a body | 0 | 73 |
Same command, same database, only the code differs. It is a deterministic replay over stored rows, so repeating it reproduces the numbers exactly. It is not a sampled estimate and carries no error bar.
It is 5 of 256, not 256 of 256. The rest are ephemeral evaluation runs that persist no session, or rows written before the display-cap fix whose bodies are unrecoverable. Nothing brings those back.
Passing is not the same as useful
With collection fixed we ran an orchestrator and took the first trajectory. The validator passed it. Here is what it contained.
tool_result  agent   [tool_use name=clarify id=chatcmpl-tool-9043d607de913a27]
tool_result  agent   [tool_use name=clarify]
tool_result  agent   [tool_use name="clarify" id="chatcmpl-tool-837c349fe54ce5cb"]
The subagent had no way to look anything up. The scenario asked for the current error rate and that deployment has no metrics tool. The 8B tried to call a tool that does not exist and emitted the markup as its final answer; the orchestrator concluded that it lacked the input to judge.
The validator checks whether an observation was cut off. It does not check whether the observation means anything. Schema checking and content checking are different jobs and you need both. Trained on as-is, this data would have taught a model to delegate into a void.
What generalises
Four were wrong defects: a label lands incorrectly, a value comes back empty. Three were absent defects: the data never arrives at all. Reading code finds the first kind. It does not find the second.
And the three each demanded a different kind of evidence. One needed row counts across two schemas. One needed the size distribution of real results. One needed running an orchestrator and opening the stored row by hand. None of them would have surfaced by reading the code longer.
Two of them were already marked done on the tracker. The fields existed. The store existed. The one adapter between them did not.
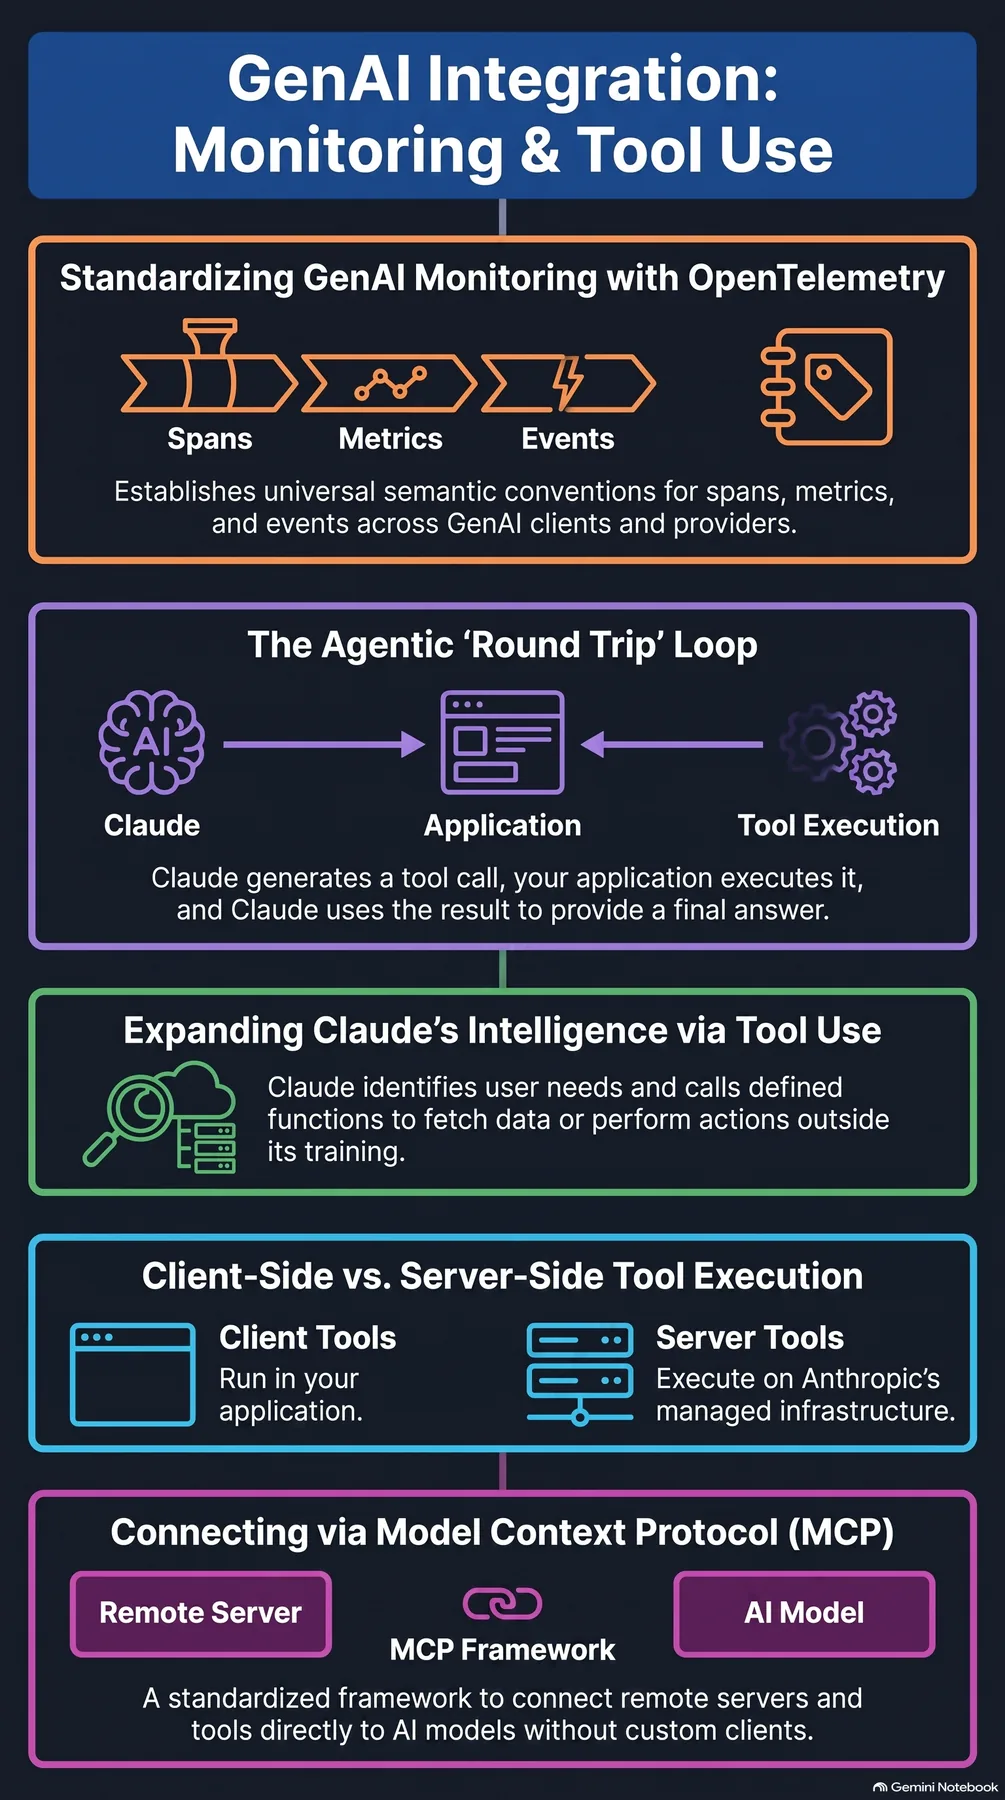 Infographic generated by NotebookLM from the sources.